Introduction
Goodman and Kruskal’s Gamma Test is described in Gamma Measure of Association. Here we show how perform the Bayesian version of this non-parametric test in Excel. Essentially this entails using the Bayesian version of Kendall’s tau test.
Example
Example 1: Repeat Example 1 of Gamma Measure of Association using a Bayesian approach (the data is repeated in range A1:E4 of Figure 1.
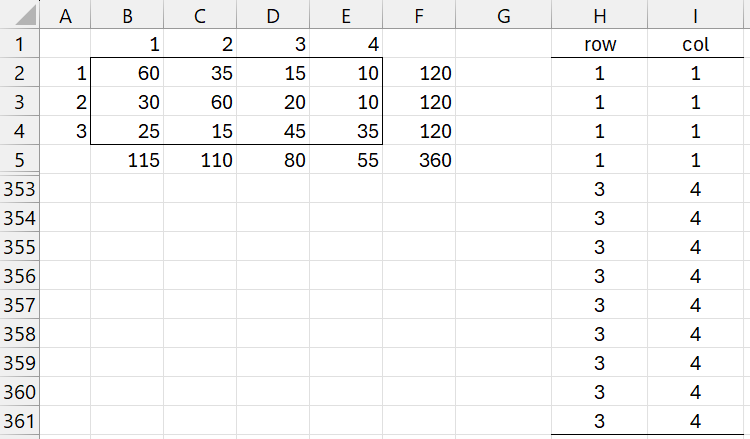
Figure 1 – Convert Gamma into Tau test
We first convert the table shown in range A1:E4 into a form used to compute Kendall’s tau, as shown in columns H and I (only the first and last of 360 rows are shown of range H2:I361). This can be done manually or by using the TABLE2RAW function as described below.
Next, we use the formula =BayesKendall(H2:H361,I2:I361,TRUE) to obtain the results shown in Figure 2 (see Bayesian Kendall’s Tau Test).
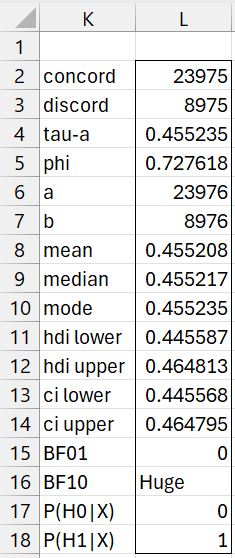
Figure 2 – Test results
Since BF10 is huge, we see that there is overwhelming support for the alternative hypothesis that gamma > 0 (gamma is equal to tau-a).
Worksheet Functions
The Real Statistics Resource Pack provides the following array functions:
TABLE2RAW(R1, nolabs): takes an m × n contingency table in R1 and outputs an equivalent k × 2 array with labels where k = the sums of the values in the contingency table. If nolabs = FALSE (default TRUE) then R1 also contains row and column labels (but not row/column totals); otherwise default labels 1, 2, … are used.
RAW2TABLE(R1): takes a two column array R1 with labels and outputs an equivalent contingency table with row and column headings. This the inverse of the existing TABLE2RAW worksheet function.
BayesGamma(R1, lab, a, b, alpha): returns an array like that shown in Figure 2 where a and b are the beta prior parameters (default 1), and alpha is used for the credible intervals (default .05). If lab = TRUE (default FALSE) then a column of labels is appended to the output.
You can obtain the results shown in range H2:I361 by using the array formula =TABLE2RAW(A1:E4) or alternatively the array formula =TABLE2RAW(B2:E4, TRUE). You could also obtain the contingency form of the table by using the formula =RAW2TABLE(H2:I361).
The output in Figure 2 can also be obtained by using the array formula =BayesGamma(B2:E4, TRUE)
Data Analysis Tool
Example 2: Repeat Example 1 using the Real Statistics Bayesian Gamma Test data analysis tool.
To use this tool for Example 1, press Ctrl-m and select the Bayesian Gamma Test option from the Bayes tab. Fill in the dialog box that appears as shown in Figure 3.
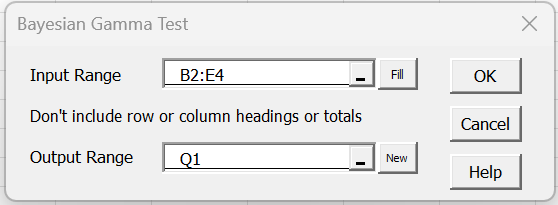
Figure 3 – Gamma Test dialog box
Upon clicking on the OK button, you obtain the output shown in Figure 4.
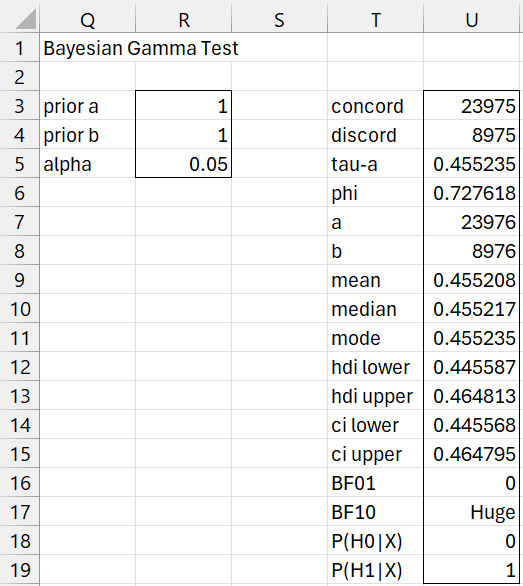
Figure 4 – Gamma Test results
Range T3:U19 contains the formula =BayesGamma(B2:E4,TRUE,R3,R4,R5).
Examples Workbook
Click here to download the Excel workbook with the examples described on this webpage.
References
Chechile, R. A., Barch, D. H. Jr. (2025) Distribution-free Bayesian analyses with the DFBA statistical package
https://link.springer.com/article/10.3758/s13428-025-02605-6