Basic Concepts
We can calculate the standard error and prediction intervals for Holt-Winters additive model forecasts as described in Exponential Smoothing Confidence Interval except that now the k-step ahead standard error is

where
Example
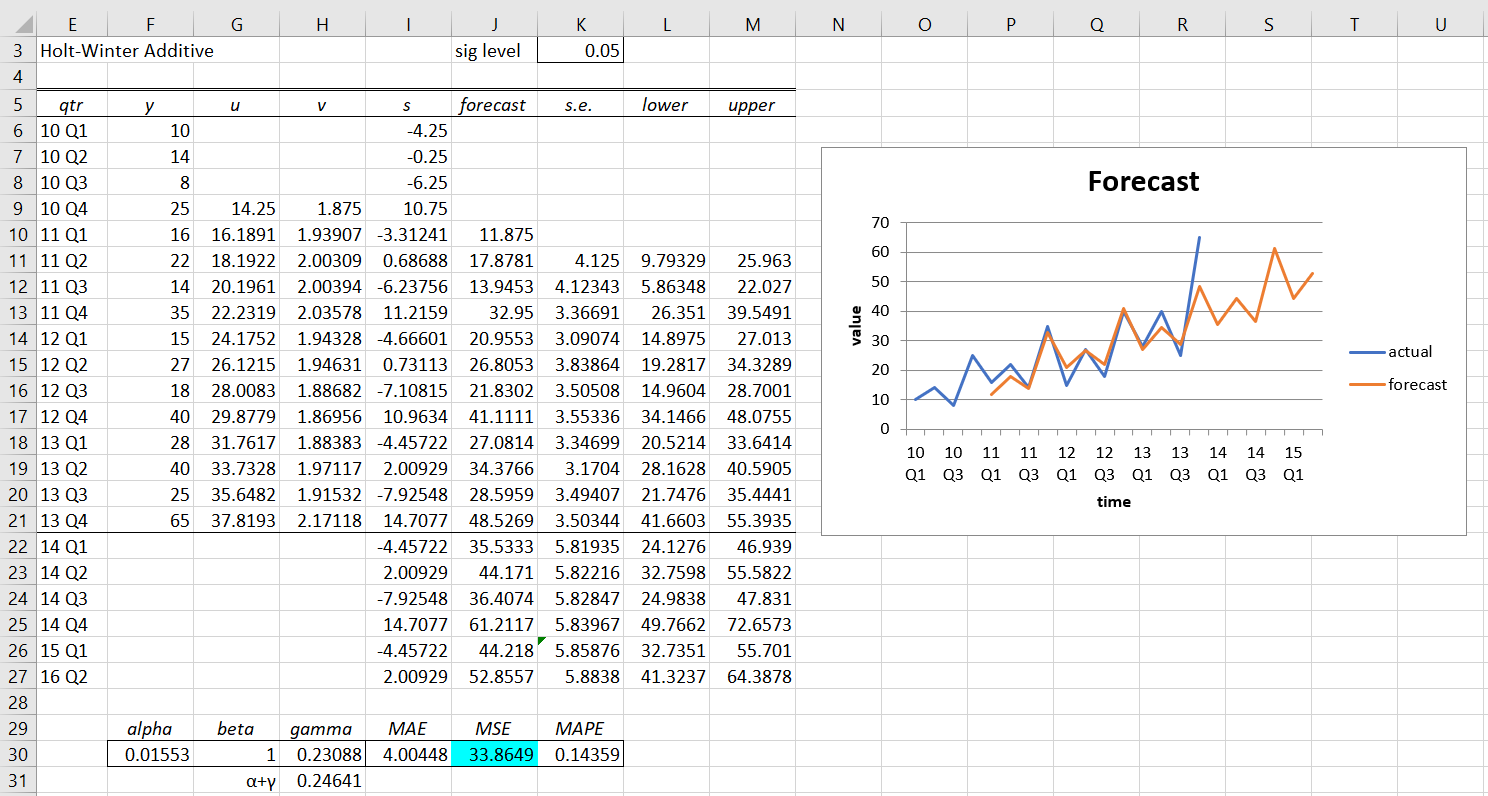
For Example 1 of Holt-Winters Additive Method, the output from the Real Statistics Basic Forecasting data analysis tool is as shown in Figure 1.
Figure 1 – Holt-Winters’ Additive Forecast
The standard errors and prediction intervals in Figure 1 are calculated exactly as for Holt’s Linear Trend (see Holt’s Linear Trend Confidence Interval) with the exception of cell J26 since this is an entry where c|i-1. The formula in cell J26 is
=K$22*SQRT((K25/K$22)^2-1+(F$30*(1+(ROW(J26)-ROW(J$22))*G$30+(1-F$30)*H$30))^2+1)
The (1-F$30)*H$30 term in this formula is not found in the other standard error formulas (although such a term would be included in the 5-step ahead, 9-step ahead, 13-step ahead, etc. standard errors).
Examples Workbook
Click here to download the Excel workbook with the examples described on this webpage.
Reference
SAS/ETS Software (1999) Forecasting process details (chapter 30)
http://www.math.wpi.edu/saspdf/ets/chap30.pdf

Hi Charles, this is very helpful; thanks!! Could you demonstrate the calculation of the prediction interval for the Holt-Winters multiplicative method?
Hello Travis,
I don’t know how to do this yet.
If you have a resource that tells me how to do this, I will add it.
Charles
Hi Charles, thanks for the great effort you’ve put into this website! It’s helping me a lot understanding how to predict a forecast in the spare part business. I cannot leave a reply in the Holt-Winters Additive main article, but I think there’s a mistake in the Baseline formula (either in the article, or the excel example).
Instead of the division of the demand per seasonality shown in the main article alpha*(Yi/Si-c), the Excel “Time Series Examples” shows that the formula is alpha*(Yi – Si-c). I changed the Excel example and, when solving alpha, beta and gamma, it gave me an alpha value of 0, and a constant Trend of 1.875. So I truly believe the Excel file is correct, and there’s a little mistake in that Baseline formula in the site. What do you think?
Hello Rodo,
Thank you very much for finding this error. I plan to make the corrections shortly.
I appreciate your help in improving the Real Statistics offering.
Charles