Standard Error and Prediction Intervals
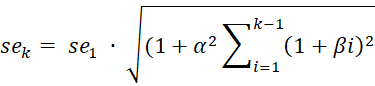
One calculates the standard error and prediction intervals for a Holt’s Linear Trend forecast as described in Exponential Smoothing Confidence Interval, except that now the k-step ahead standard error is
Data Analysis Tool
Example 1: Use the Basic Forecasting data analysis tool for Example 3 of Holt’s Linear Trend.
Press Ctrl-m and select the Basic Forecasting option from the Time S tab. Fill in the dialog box that appears as shown in Figure 4 of Simple Moving Average, except that this time choose the Holt’s Linear Trend option and MAE optimization (and so Real Statistics will automatically select the alpha parameter that optimizes the MAE value).
After clicking on the OK button, the output shown in Figure 1 appears (although the chart, which is the same as in Figure 3 of Holt’s Linear Trend, is not displayed).
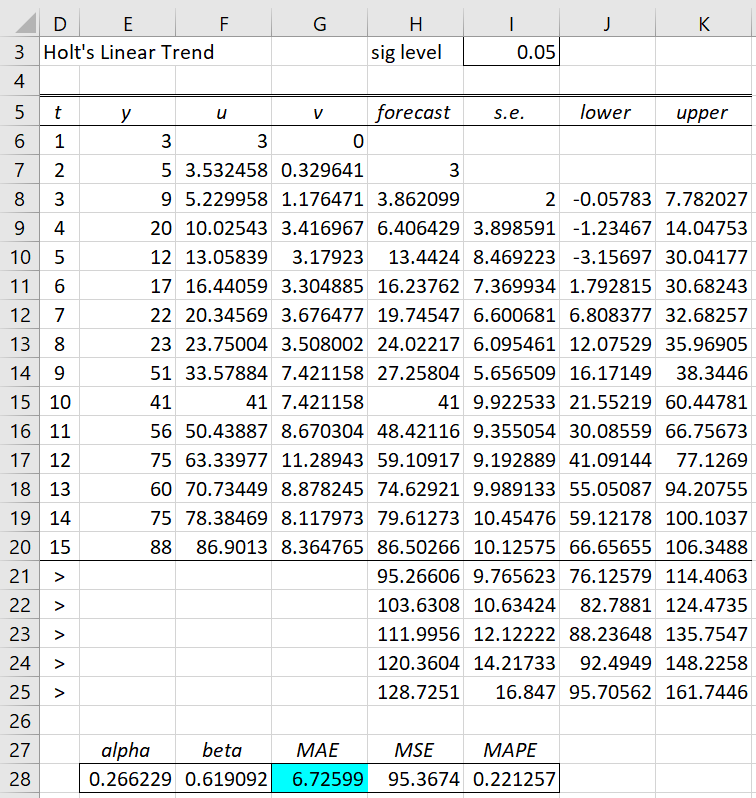
Figure 1 – Holt Linear Trend data analysis
Note that for Example 1 of Holt’s Linear Trend, we would proceed in the same way, except that we need to explicitly specify Alpha as .4, Beta as .7, and set the optimization option to None.
Key Formulas
The output contains the standard errors and 95% confidence intervals (based on the value in cell I3). The formula in cell H21 is
=$F$20+$G$20*(ROW(F21)-ROW($F$20))
and similarly for the other forecasted values. The formula used to calculate the standard error for the first forecasted value (shown in cell I23) is
=SQRT(SUMXMY2(E$7:E20,H$7:H20)/COUNT(H$7:H20))
The formula used to calculate the standard error of the fifth forecast value is
=I$21*SQRT((I24/I$21)^2-1+(E$28*(1+(ROW(H25)-ROW(H$21))*F$28))^2+1)
in cell I25. The corresponding upper confidence interval limit (cell K25) for this forecast value is calculated by the formula
=H25+NORM.S.INV(1-I$3/2)*I25
Optimization Approach
Note that the Real Statistics data analysis tool identifies values for alpha and beta that produce a lower value for MAE than that produced by Solver, as shown in Example 2 of Holt’s Linear Trend. This is because the data analysis first calculates MAE for all values of alpha and beta between 0 and 1 in increments of .005. Once it finds the values of alpha and beta that produce the smallest MAE value, it then uses Solver based on these initial values to further optimize the value of MAE.
Links
Examples Workbook
Click here to download the Excel workbook with the examples described on this webpage.
Reference
SAS/ETS Software (1999) Forecasting process details (chapter 30)
http://www.math.wpi.edu/saspdf/ets/chap30.pdf
Hyndman, R. J., and Athanasopoulos, G. (2018) Holt’s linear trend method. Forecasting: principles and practice, 2nd Ed.
https://otexts.com/fpp2/holt.html
for the forecast part where you don’t have the actual y’s, the calculation for the s.e. results in number growing. as a result the range between upper and lower is growing as the number of forecast is done. is something missing in the formula?
Hello,
It is not surprising that the s.e. gets bigger as time advances. There should be more unpredictability the further in the future you go.
This is reflected in the formula and the results in Figure 1.
Why do you think something is missing in the formula since the value increases over time?
Charles
This is tremendously helpful! Can I ask where you got the formula for standard error? You’ve referenced “Forecasting: Principles and Practice” elsewhere, but this doesn’t seem to line up with any of the formulas they mention for prediction intervals here: https://otexts.com/fpp2/ets-forecasting.html#prediction-intervals-2
Hi Jerry,
Glad I could help and sorry for the delayed response.
I couldn’t find the formula for the standard error of Holt’s Linear Trend in the reference that you gave. It seems to refer to a book entitled Forecasting with Exponential Smoothing: the State Space Approach, which I don’t have. The only standard error I found in your reference is for a different model.
The estimate I used is based on the following:
SAS/ETS Software (1999) Forecasting Process Details (Chapter 30)
http://www.math.wpi.edu/saspdf/ets/chap30.pdf
Charles
Great, thanks!