Basic Concepts
An alternative version of the log-rank test (see Log-Rank Test) is based on
Note that you can interchange the roles of A and B in the above formulas and get the same answer.
Wilcoxon Test
The Wilcoxon Test (aka Breslow Test) is based on
Tarone-Ware Test
The Tarone-Ware Test is based on
Comparing the tests
All these comparison tests will have different results.
The Log-Rank Test (alternative version) tends to perform best towards the right side of the survival curves (i.e. for higher values of t). The Wilcoxon Test tends to perform best on the left side of the survival curves (i.e. lower values of t). The Tarone-Ware Test tends to perform best in the middle.
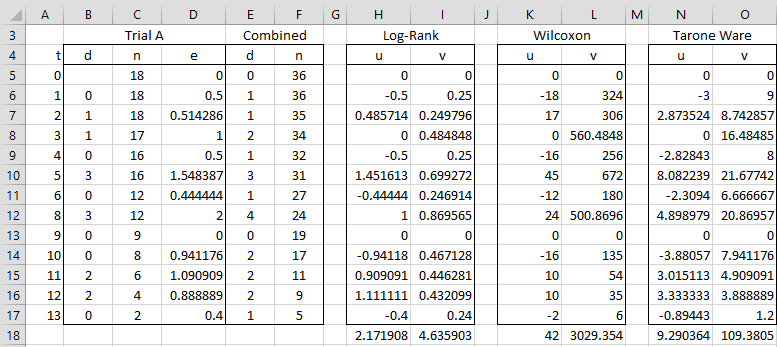
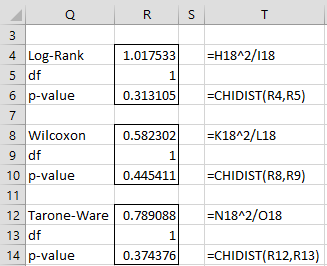
For the data in Example 1 of Log-Rank Test, the results of these tests are presented in Figure 1 and 2.
Figure 1 – Calculations for the various comparison tests
Figure 2 – Comparison test results
We see from Figure 2 that the three tests have fairly similar test statistics and p-values. All show that there is no significant difference between the two cancer drugs.


Hi.
I`m working with three different groups and I will like to know statistical differences between them. In your example I can see you compare between two groups, but if I have three what should I do?
Hi Pauline,
The following link might be helpful:
https://ncss-wpengine.netdna-ssl.com/wp-content/themes/ncss/pdf/Procedures/NCSS/Kaplan-Meier_Curves-Logrank_Tests.pdf
Charles
Sir,
Is there any method so that tick mark or cross mark for censored data appear or put on the Survival curve?
Hello Binod,
To add tick marks to an Excel chart, see
https://support.microsoft.com/en-us/office/change-the-display-of-chart-axes-422c97af-1483-4bad-a3db-3a9ef630b5a9#:~:text=Add%20tick%20marks%20on%20an%20axis&text=Click%20the%20chart%2C%20and%20then,and%20minor%20tick%20mark%20types.
Charles
Sir,
The link explains the adjustment to the tick marks on the horizontal or vertical axis line of chart. In fact I wanted to put cross or tick mark for censored data on the survival curve line itself as prepared from the formula given by you.
Dear Charles
I am performing a Kaplan-Meier analysis on the survival of restored seedlings. As I am dealing with critically rare plants, I have 17 seedlings at one site and 8 at another. I have done the comparison tests but not sure which is the best to chose for small sample sizes of unequal size. Do you perhaps have a suggestion?
Thank-you for the great site and information.
Carin,
Sorry, but i don’t have any further advice from that written on the webpage.
Charles
Thank you so much Professor Charles. but i will like to know the content of column R. I am working on this example you gave but i cant get my p-value. Please, how do i go about that. Thanks in anticipation. Teniola
The contents of column R are shown in column T of Figure 2.
Charles
Thanks for this website, it is really nice.
What if we have more than 2 groups. What is the V equation in this case.
Shebli,
Glad you like the website.
Sorry, but I haven’t yet looked into the case with more than 2 groups. I’ll add this to the list of potential future enhancements.
Charles