As described in When t Test Assumptions are Violated, there are a number of substitute tests that can be used when the t Test assumptions don’t hold. We now describe a data analysis tool that can be used for three of these tests. Namely, the Trimmed Means t Test, Yuen-Welch’s t Test, and the Fligner-Policello non-parametric test.
In particular, we show how to use this data analysis tool for the data in Example 1 of the Trimmed Means t Test.
Data Analysis Tool
Real Statistics Data Analysis Tool: The Real Statistics Resource Pack provides the Other Two Sample Tests data analysis tool.
To use this data analysis tool for Example 1 (whose data is repeated on the left side of Figure 2), press Ctrl-m and select the Other Two Sample Tests option from the Misc tab (or from the main menu if using the original user interface) and then fill in the dialog box that appears as shown in Figure 1.
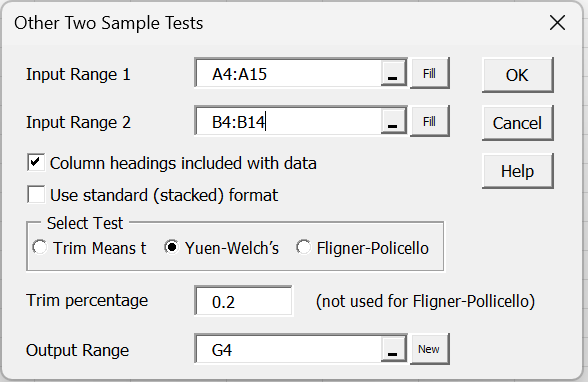
Figure 1 – Other Two Sample Tests dialog box
After clicking on the OK button, the output in range G4:H10 of Figure 2 appears.
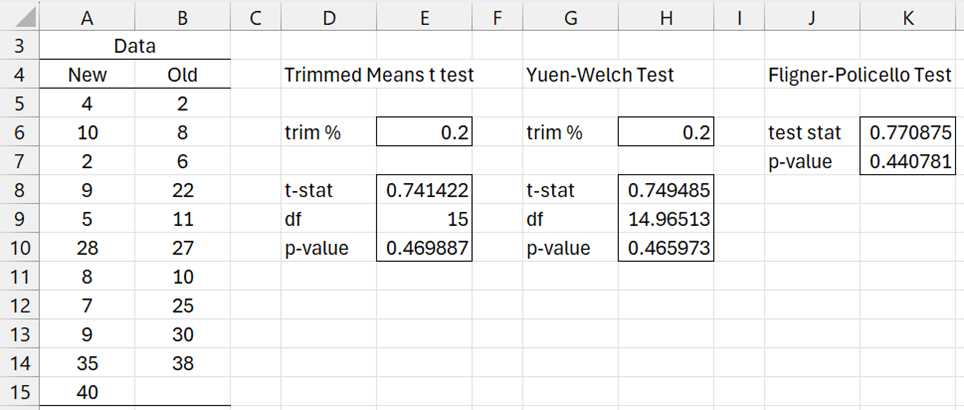
Figure 2 – Data analysis tool output
To obtain the output shown in ranges D4:E10 and J4:K7, you need to run the data analysis twice more selcting the appropriate test.
Stacked Format Data
You can also use this data analysis tool with data in standard (stacked) format. Figure 3 shows the results for the Trimmed Means t Test using the data in range A3:B23. This time we need to insert A3:B23 in the Input Range 1 field of the dialog box shown in Figure 1 and leave Input Range 2 empty. We also need to uncheck Column headings included with data, check Use standard (stacked) format, and select the Trim Means t option.
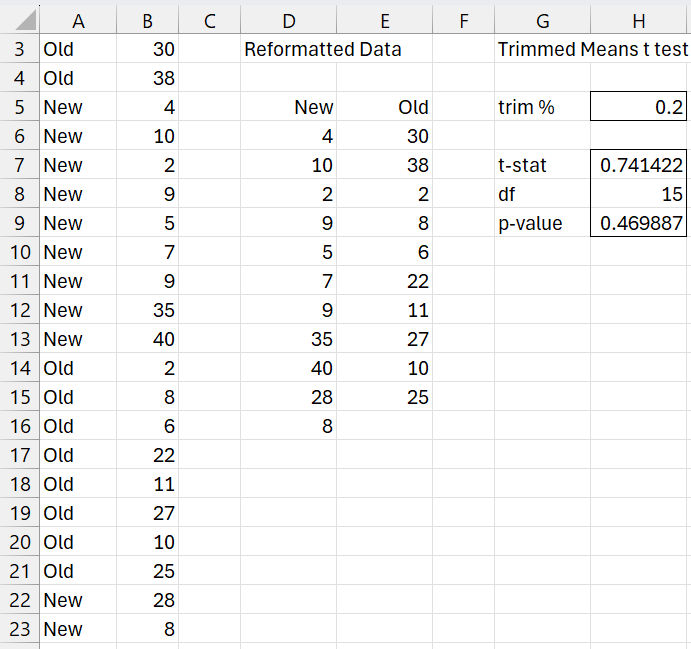
Figure 3 – Analysis for data in stacked format
Examples Workbook
Click here to download the Excel workbook with the examples described on this webpage.
Reference
Steiger, J. H. (2009) Robust t Tests
https://www.statpower.net/Content/311/Lecture%20Notes/RobustT.pdf