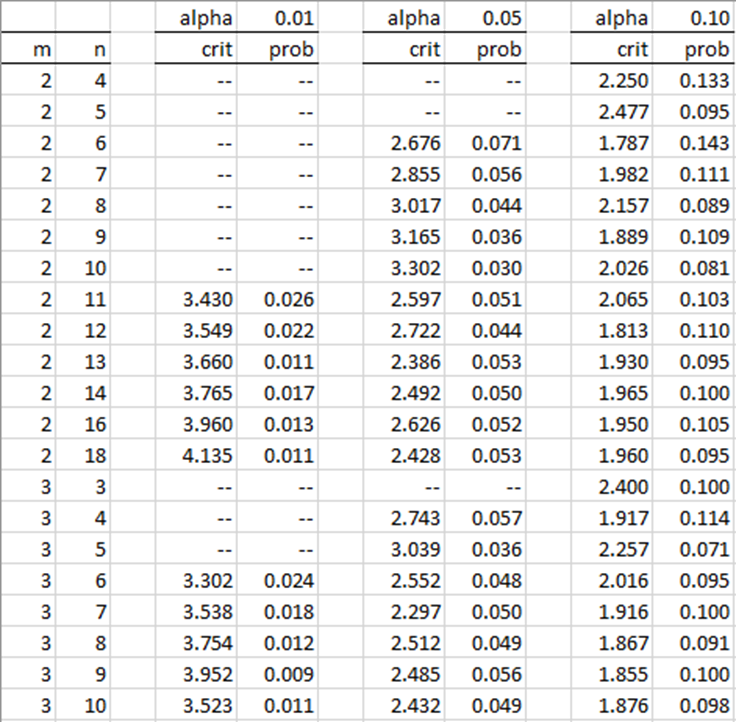
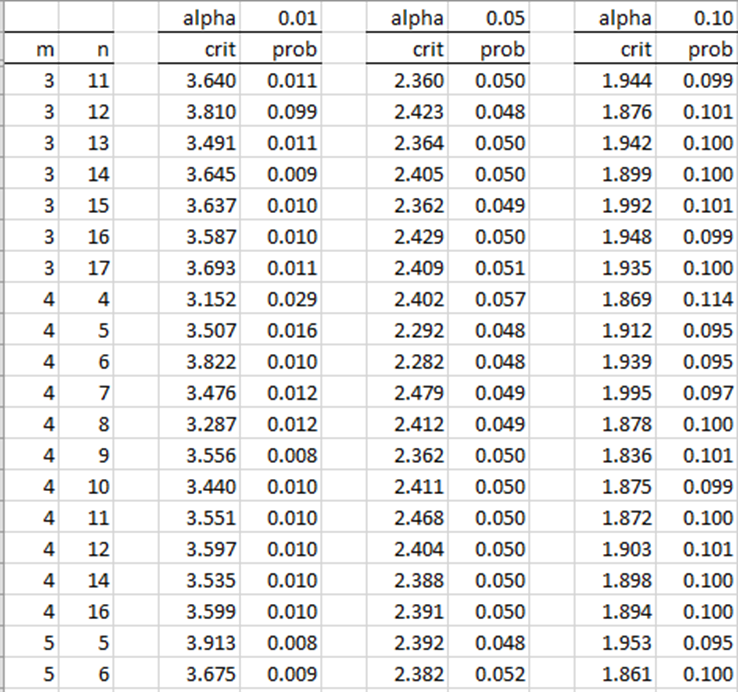
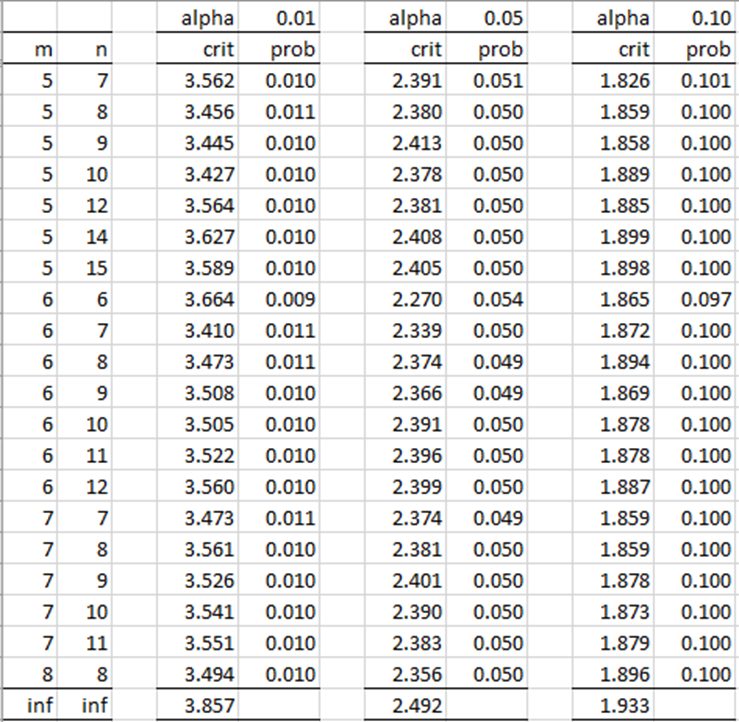
The following are tables of critical values for the Two-Sample Anderson-Darling Test for small samples. Here m and n represent the sample sizes.


Download Table
Click here to download the Excel workbook with the above table.
Reference
Pettitt, A. N. (1976) A two-sample Anderson-Darling rank statistic. Biometrika, 63, 161-168.
https://www.semanticscholar.org/paper/A-two-sample-Anderson-Darling-rank-statistic-Pettitt/31a38142b2f78fb54487fa928b04ff4efa517bba
Hi everyone,
I need your help here. I have a sample size of 147 tree plots, (deciduous forest-93 plots, Mixed forest-30 and coniferous forest-24 plots. Furthermore, the 147 plots were categorized into large trees-88 plots and small trees – 57 plots. I would like the perform two-way ANOVA but the data was unmatched. How do I analyze this?
Hello Tuco,
What do you mean by “the data was unmatched”?
Charles