The Real Statistics Resource Pack provides functions and a data analysis tool for Item Analysis. We will describe these functions on this webpage.
Worksheet Functions
Real Statistics Functions: The Real Statistics Resource Pack provides the following worksheet functions:
ITEMDIFF(R1, mx) = item difficulty for the scores in R1 where mx is the maximum score for the item (default 1).
ITEMDISC(R1, R2, p, mx) = item discrimination index based on the top/bottom p% of total scores (default .27) where R1 contains the scores for each subject for a single item, R2 contains the corresponding total scores for all items and mx is the maximum score for the item whose scores are contained in R1 (default 1).
Example
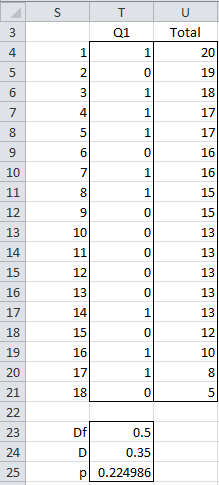
Example 1: Repeat Example 1 of Item Analysis Basic Concepts with the data in Figure 1.
Figure 1 – Item Analysis calculations
We can calculate the difficulty index (cell T23) using the formula =ITEMDIFF(T4:T21), the discrimination index (cell T24) using the formula =ITEMDISC(T4:T21,U4:U21,1/3) and the point-biserial correlation coefficient (cell T25) via the worksheet formula CORREL(T4:T21,U4:U21).
Discrimination Index
The high-skilled group nominally consists of subjects 1 through 6 (where 6 = 18/3) with the sum of scores for Q1 of 4 in this group. But note that the 6th and 7th subjects both have a total score of 16. Thus we need to take the average of their scores on Q1, namely .5, as their contribution to the high-skilled group. Since subject 6 contributed 0 to the score of 4, we need to add .5 to get a score of 4.5 for the high-skilled group.
The situation for the low-skilled group, nominally subjects 13 through 18, is even more complicated. The sum of scores for Q1 in this group is 3, but two members of this group have the same total scores, namely 13, as do three members in the medium-skilled group. The sum of the scores for Q1 of these five subjects is 1.
Thus we view the contribution of these five to the Q1 score for the low-skilled group as the weighted average, namely 2/5 (i.e. 2 available slots in the low-skilled group times 1 point for Q1 among all 5 subjects tied with 13 total points). Since the sum of the Q1 scores for subjects 14 through 18 is 2, we need to add 2/5 to get a total of 2.4 for the low-skilled group instead of 3.
Putting all of this together we see that the discrimination index is (4.5-2.4)/6 = .35. The Real Statistics function ITEMDISC handles all these details automatically, where ITEMDISC(T4:T21, U4:U21,1/3) = .35. Note that if we use the default value of p = .27, we get ITEMDISC(T4:T21, U4:U21) = .36.
Examples Workbook
Click here to download the Excel workbook with the examples described on this webpage.
References
Matlock-Hetzel, S. (1997) Basic concepts in item and test analysis. Texas A&M
http://ericae.net/ft/tamu/Espy.htm
Office of Educational Assessment (2016) Understanding item analysis. University of Washington
http://www.washington.edu/assessment/scanning-scoring/scoring/reports/item-analysis/
Vallejo-Elias, J.(2016) Interpretation of discrimination data from multiple-choice test items
No longer available online
Albano, A. (2016) Introduction to educational and psychological measurement, Course Notes. University of Nebraska-Lincoln
https://digitalcommons.unl.edu/cgi/viewcontent.cgi?article=1005&context=prtunl

Hi Charles,
Very useful tool. I’ve installed it and tried it with the data set above.
ITEMDIFF is fine and gives me the right value. However ITEMDISC gives me 0.36 instead of 0.35.
I get the same values (0.5 and 0,35) when doing the calculations the normal way.
Any idea why I am seeing this difference?
Jon,
For the example, p = 1/3, in which case the correct answer is .35, as shown on the webpage. There is an error though since the formula used should be =ITEMDISC(T4:T21,U4:U21,1/3). If instead you the default value for p, namely .27, you do indeed get ITEMDISC(T4:T21,U4:U21) = .36. I have now revised the webpage to make this clearer. Thanks for bringing this issue up.
Charles
Have you used your functions to analyze item banks? I am curious about how to go about doing that using your functions. In your example every student attempts to answer Q1. I’m working with an item bank where only a subset of students get assigned each test item.
Thanks!
Lewis
Lewis,
Some of the functions work in this case, others don’t. I have experience working with test banks.
Which capabilities are you interested in using?
Charles
For the point-serial correlation, do I need to include the last column of the data as the total score of the test? It seems the function calculates the correlation between the first column and the last column.
Ying,
Yes, you need to include the last column with the total score.
Yes, the function calculates the correlation between the first column and the last column.
Charles