Real Statistics Data Analysis Tool: The Real Statistics Resource Pack provides the Reliability data analysis tool, which can be used to create a Bland-Altman Plot.
Input
To create the Bland-Altman Plot for Example 1 of Bland-Altman Plot, press Ctrl-m and choose the Interrater Reliability option from the Corr tab of the Multipage interface, as shown in Figure 2 0f Real Statistics Support for Cronbach’s Alpha. If using the original interface, then select the Reliability option from the main menu and then the Interrater Reliability option from the dialog box that appears, as shown in Figure 3 of Real Statistics Support for Cronbach’s Alpha.
In either case, fill in the dialog box that appears as shown in Figure 7 of Cohen’s Kappa, by inserting A3:B23 in the Input Range, selecting Bland-Altman, and making sure that the Column headings included with data option is selected.
Output
You next click on the OK button to obtain the results shown in Figure 1.
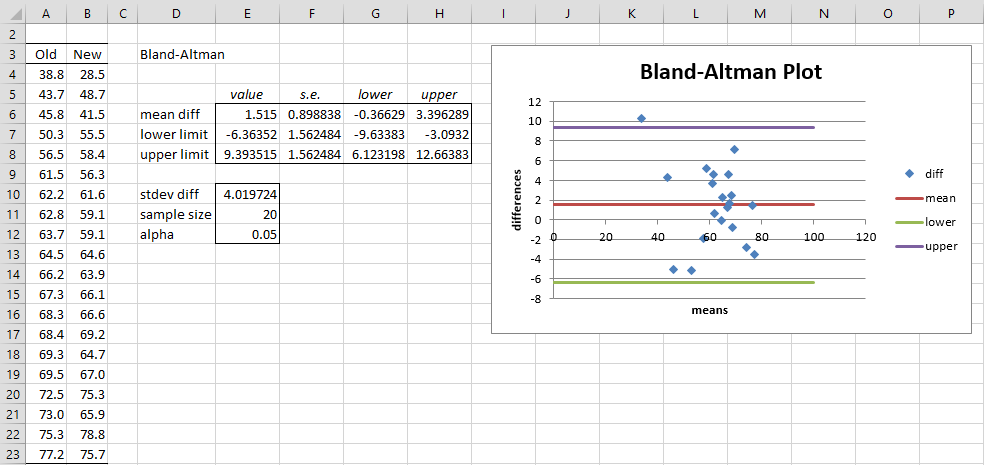
Figure 1 – Bland-Altman data analysis tool
Examples Workbook
Click here to download the Excel workbook with the examples described on this webpage.
Links
References
Giavarina, D. (2015) Understanding Bland-Altman. Biochemia Medica
https://www.ncbi.nlm.nih.gov/pmc/articles/PMC4470095/
Bland, J. M. and Altman, D. G. (1986) Statistical methods for assessing agreement between two methods of clinical measurement. Lancet, 1986 pp 307-310
https://pubmed.ncbi.nlm.nih.gov/2868172/
For Bland-Altman plot, is it necessary to check the box for ‘Column headings included with data’? It prides me N-1 data sets. If it is unchecked the ‘Reliability’ will provide me N data points? For Bland-Altman plot, which way is preferred?
Thanks.
Xia Ge,
If you have column headings then you would check the Column headings included with data option. The first item in the data would not be analyzed since it would be a heading.
If you don’t have column headings then you would uncheck this option. All the data would be used.
Charles
can bland altman be used for data that is not normally distributed
Varum,
See
https://real-statistics.com/reliability/bland-altman-analysis/bland-altman-plot/
Charles
Hello, I am starting to attempt to utilize this software but don’t see the “Reliability” option, to build an Altman’s plot. Running excel 2016 Mac. Any thoughts?
Disregard, I figured it out. I see it under interrater Reliability. Thanks for this great tool for people to utilize. It is an amazing add in and very much appreciated!