Linearity Test
The key assumption of Passing-Bablok regression is linearity. This can be tested using the following steps:
Step 1: Define ŷi = bxi + a for each i and define n+ = # of i such that yi > ŷi and n– = # of i such that yi < ŷi. Now define the ri by
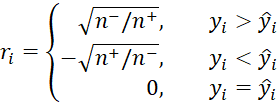 Step 2: For each i, define the distance di by
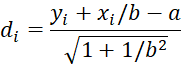
Step 3: Sort the ri in the order of the di.
Step 4: Define the ci and cmax by
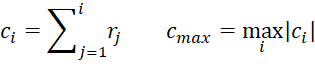
Step 5: Test the null hypothesis that there is a linear relationship between the xi and yi using the test statistic
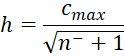
For any significance level α, we get a significant result (and so there isn’t a linear relationship between the xi and yi) when h ≥ hcrit, where hcrit is the critical value from the Kolmogorov distribution at α, which can be calculated using the Real Statistics formula KINV(α). Figure 1 displays hcrit values for key values of alpha.

Figure 1 – h-crit values
Note that instead of steps 4 and 5, we could use a runs test to check for randomness, which is essentially what the KS test in steps 4 and 5 is doing.
Example
Example 1: Determine whether the linearity assumption holds for Example 1 of Passing-Bablok Regression Basic Concepts.
The test is carried out as shown in Figure 1. Since h < h-crit (AJ8 and AJ9), or p-value = .92 > .05 = α (AJ10), we conclude that the linearity assumption is likely to hold.
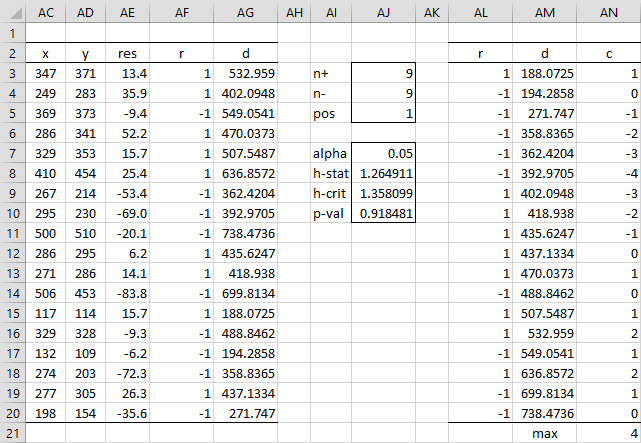
Figure 1 – Testing linearity
Some representative formulas from Figure 1 are shown in Figure 2.
 Figure 2 – Key formulas from Figure 1
Note that the formulas in range AL2:AM20 and cell AN21 are array formulas.
Links
Examples Workbook
Click here to download the Excel workbook with the examples described on this webpage.
Reference
Hintze, J. L. (2020) Passing-Bablok regression for method comparison. NCSS
https://www.ncss.com/wp-content/themes/ncss/pdf/Procedures/NCSS/Passing-Bablok_Regression_for_Method_Comparison.pdf
Dear Charles,
I have one question about the p-val. Because the h-stat lies between values for alpha 0.05 and 0.10 in Figure 1, I expect the p-val between these two values. Am I wrong? Let’s imagine the situation, where alpha is 0.10.
Best regards,
Jirka