I am pleased to announce Release 4.9 of the Real Statistics Resource Pack. The new release is now available for free download (Download Resource Pack) for Excel 2010, 2013 and 2016 (Windows version) environments. It will be available for free download for Excel 2007 environments later today.
The spreadsheets for all the examples used on the Real Statistics website are available for free download (Download Examples Workbooks). These spreadsheets are contained in four Excel files (i.e. workbooks):
- Examples Workbook Part 1
- Examples Workbook Part 2
- Multivariate Examples
- Time Series Workbook
See Workbook Examples for a description of which examples are contained in which files.
On May 26, the Time Series Workbook was updated with all the examples from the previous release of the Real Statistics software. Today, the Examples Workbook Part 1 and Examples Workbook Part 2 have been updated with examples based on today’s release.
The Real Statistics website will be updated over the course of the next several days to reflect the new capabilities in Release 4.9.
Release 4.9 contains the following new features:
Design of Experiments
A new Design of Experiments section is being added to the website, This section describes the following new data analysis tools:
- Randomized Complete Block Design
- Split-Plot Design
- Latin Squares Design
Contrasts and Tukey’s HSD tests are also provided for each of these designs.
New User-Interface
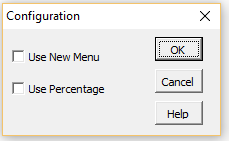
A new Config command button has been added to the main interface to the Real Statistics data analysis tools (which is accessible via Ctrl-m or the Add-Ins ribbon). If you click on the Config button (located on the right side of the main dialog box) you will be presented with the following dialog box:
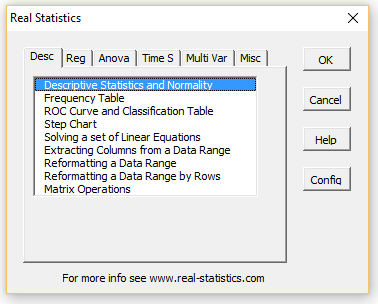
If you click on the Use New Menu option and press the OK button, the main menu will change to the following multi-page format:
The various data analysis tools are now organized into the following six tabs:
- Descriptive Statistics and Utilities (Desc)
- Regression (Reg)
- Anova (Anova)
- Time Series (Time S)
- Multivariate Analysis (Multi Var)
- Miscellaneous (Misc)
You can also access the Configuration dialog box (e.g. to change back to the old menu format) by clicking on the Config button.
Default decimal values in dialog boxes
On many of the dialog boxes the user can enter a value for Alpha by overriding the default value of .05. Because Excel accepts both the 0.05 and 0,05 formats for decimals, this has introduced problems for some users. This new release provides the following two potential solutions to this problem:
- Simply enter a zero in the Alpha field. This should not produce an error message. You will need to change the value of Alpha in the output report since a significance level of zero is not really acceptable statistically.
- Use the new Use Percentage configuration option (as shown above). If you choose this option on the Configuration dialog box, then the default value for Alpha will be 5 (representing 5%) and so no decimal will be required. You can override the default value by entering some other whole number (e.g. 1 representing 1%).
ANOVA post-hoc tests enhancements
A p-value has now been added to the various data analysis tools that support Tukey’s HSD, Tukey-Kramer, Scheffe, Nemiyi and Games-Howell post-hoc tests.
New F_DIST function
Excel’s FDIST and F.DIST functions only accept positive integer values for the degrees of freedom. The Real Statistics F_DIST function takes the form F_DIST(x, df1, df2, cum) where df1 and df2 can take any positive value, including values less than 1.
Revised Welch’s test
The function WELCH_TEST and the Welch’s Anova option of the One-Factor ANOVA data analysis tool have been revised to use the new F_DIST function instead of FDIST. This yields more accurate results.
Reformatting enhancements
On the Reformatting Data Range data analysis tool, when you fill in either the # of Rows or # of Columns options and leave the other blank, then its value will automatically be calculated to the least value capable of holding all the data in the Input Range.
A new version of the RESHAPE array function has been provided (at the request of Oliver). The previous version (still supported) takes the form
RESHAPE(R1, c) – fills the highlighted range with the data in range R1 (using the character c to fill in any extra cells, with c defaulting to #N/A)
The new version takes the form RESHAPE(R1, c, nrows, ncols), which allows you to explicitly specify the # of rows and columns in the output. This enables you to call this function from within another function. E.g. suppose that you have a column of data in the range A1:A9, you could calculate =eVALUES(RESHAPE(A1:A9,,3,3)).
Jarque-Barre normality test option
The Real Statistics implementation of the Jarque-Barre test for normality has now been expanded. The functions JARQUE and JBTEST now take the forms JARQUE(R1, pop) and JBTEST(R1, pop). When pop = True (default) the population forms of the skewness and kurtosis is used, while when pop = False the sample forms are used.
Fleiss’s Kappa enhancement
An argument has been added to the Real Statistics KAPPA function. When this argument is set to True then the calculation for the standard error for Fleiss’s Kappa in the original paper by Fleiss will be used instead of the calculation previously employed; the default for this argument is False (i.e. the previous calculation)
Bug Fixes and Minor Changes
- The control tips and tab order on many of the data analysis tool dialog boxes have been corrected or revised
- The spelling of the SHAPELY function has been changed to SHAPLEY (for the Shapley-Owen Decomposition)
- The DCRIT function (critical value from the Dunnett’s test table) now returns values for df larger than 240 (previously an error value was generated)
- The QDIST function (p-value of the Studentized range distribution) now returns values for large values of df (previously an error value was generated)
- The W value for n = 49 and alpha = .02 in the Shapiro-Wilk Table (Table 2) has been changed to .937 (from .0937). Thus, the formula =SWProb(49,0.937,FALSE) now yields the value .02.
- The Freeze option on the Reformatting a Data Range by Rows data analysis tool no longer pertains to the Sort by Rows option.

