In Excel Charts, we show how to create a step chart in Excel. We now show an easier way to do this.
Data Analysis Tool
Real Statistics Data Analysis Tool: The Real Statistics Resource Pack contains the Step Chart data analysis tool which creates up to six step charts.
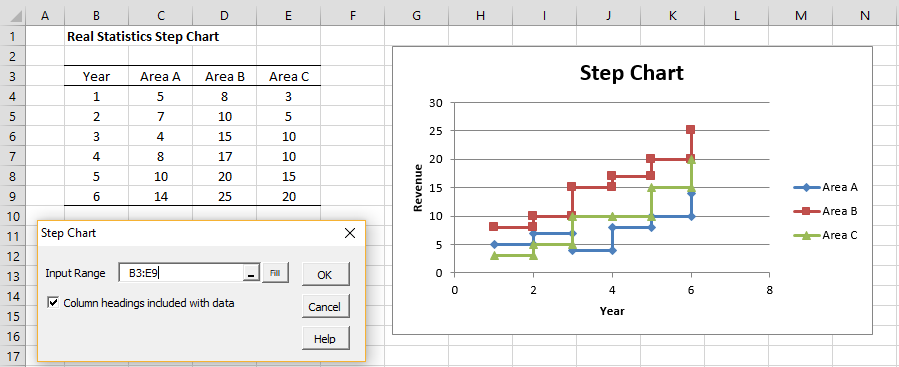
Example 1: Use the Real Statistics Step Chart data analysis tool to create the step chart for the data in range B3:E9, press Ctrl-m, choose the Step Chart option from the Desc tab (or double click on the Step Chart option if using the original user interface), fill in the dialog box that appears as shown on the lower left side of Figure 1 and click on the OK button.
The output is shown on the right side of Figure 1.
Figure 1 – Step Chart
Examples Workbook
Click here to download the Excel workbook with the examples described on this webpage.
Reference
Extend Office (2021) How to create a step chart in Excel
https://www.extendoffice.com/documents/excel/4987-excel-step-chart.html

Apologies Charles for my last comment; reading your post with more/some care I can see I need to have the addin for this to work. Makes sense.
Happy new year!
This .xlsx file seems to have lots of #NAME? errors, due to call to a UDF(?) QSORTRows There are also two defined names with #REF errors. So, in my downloaded version at least, no functioning graph.