Basic Concepts
The M/M/s queueing model describes the same queueing process as the M/M/1 queueing model, except that s servers are used, where s is a positive integer. When s = 1, this model is equivalent to the M/M/1 model.
Once again, customer arrivals follow an exponential distribution at the rate of λ. Servicing also follows an exponential distribution with a service rate of μ for each server. We assume that when more than one server is available, the customer chooses randomly.
This time we set τ = λ/μ and ρ = λ/(μs). We will assume that ρ < 1 since, in this case, the process arrives at a steady-state (as defined in Queueing Theory).
Balance Equations
The steady-state equations for the M/M/s model are as follows.
μp1 = λp0
(λ + nμ)pn = λpn-1 + (n + 1)μpn+1 for n < s
(λ + sμ)pn = λpn-1 + sμpn+1 for n ≥ s
Number of customers in the system
The probability pn that n customers are present in an M/M/s model in a steady-state can be calculated by the following formulas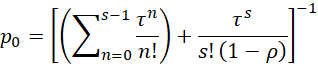
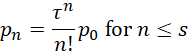
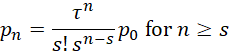
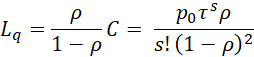
We can use the notation Pn = p0 + p1 + ⋅⋅⋅ pn. In particular, we use the notation C as the probability that when a new customer arrives it finds all the servers occupied and so the customer must queue. It turns out that

Key properties
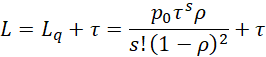
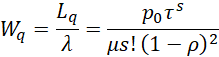
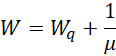
The following mean values hold for M/M/s models in a steady state:
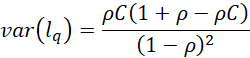
The corresponding variances are

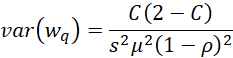

where if τ ≠ s – 1
![E[w^2] tau not s + 1](https://real-statistics.com/wp-content/uploads/2023/02/image016.png)
while if τ = s – 1
![E[w^2] tau = s +1](https://real-statistics.com/wp-content/uploads/2023/02/image017.png)
Distribution of w and wq
The following formulas hold for M/M/s models in a steady state.

When τ ≠ s – 1

while if τ = s – 1

Example
Example 1: Calculate the various parameters for an M/M/s queueing model with 3 servers where λ = 1.5 and μ = 2.
The results are shown in Figures 1 and 2.
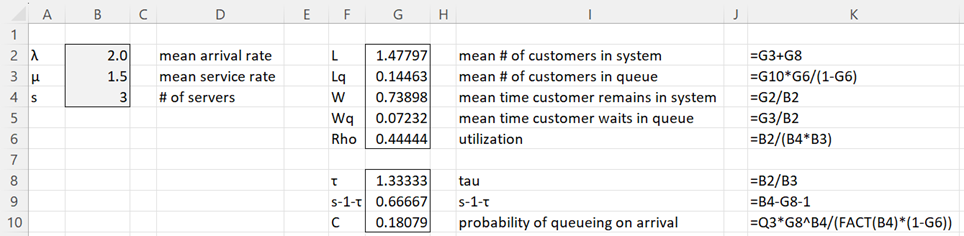
Figure 1 – M/M/s queueing model (part 1)
Columns M and N of Figure 2 are used to calculate p0. Cell N3 contains the formula =G$8^M3/FACT(M3). The other values in column N are filled in by highlighting range N3:N12, and pressing Ctrl-D. The value for p0. (in cell N16) is calculated via the formula
=1/(SUM(OFFSET(N3,0,0,B4,1))+OFFSET(N3,B4,0,1,1)/(1-G6))
For Example 1 with s = 3, this formula is equivalent to =1/(SUM(N3:N5)+N6/(1-G6). The advantage of the above formula is that it works with any value of s (although the values in column N need to be extended for s > 12).
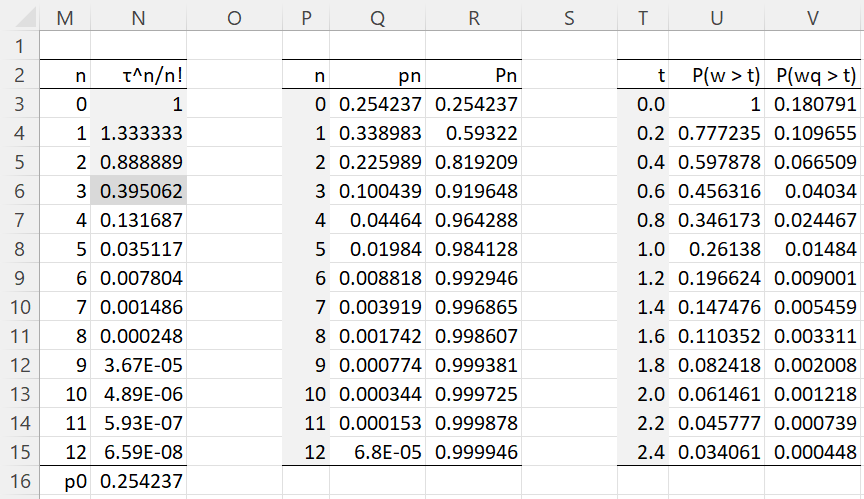
Figure 2 – M/M/s queueing model (part 2)
Note that cell Q4 contains the formula
=Q$3*IF(P4<B$4,N4,G$8^P4/(FACT(B$4)*B$4^(P4-B$4)))
and R4 contains =R3+Q4, and similarly for the other formulas in columns Q and R.
Cell U3 contains the formula
=EXP(-B$3*T3)*(1+G$10*IF(G$9=0,B$3*T3,(1-EXP(-B$3*T3*G$9))/G$9))
and cell V3 contains the formula
=G$10*EXP(-B$4*B$3*T4*(1-G$6))
The other formulas in columns U and V are similar.
Worksheet Functions
Excel Functions: The Real Statistics Resource Pack supports the following array function.
MMs(λ, μ, s, lab): returns a column array with the L, Lq, W, Wq, ρ for the M/M/s queueing model with s servers and exponential arrival and service rates with mean arrival rate λ and mean service rate μ.
If lab = TRUE (default FALSE) then an extra column of labels is appended to the output. In addition, the following non-array functions are also supported.
MMsPn(λ, μ, s, n, cum) = pn for the M/M/s queueing model defined by s, λ, and μ if cum = FALSE (default) and Pn otherwise.
MMsW(λ, μ, s, t) = P(w > t) for the M/M/s queueing model defined by s, λ and μ
MMsWq(λ, μ, s, t) = P(wq > t) for the M/M/s queueing model defined by s, λ and μ
You can obtain the values in range F2:G6 of Figure 1 via the array formula =MMs(B2,B3,TRUE). You can obtain the values in Figure 2 by inserting =MMsPn(B$2,B$3,M3) in cell N3 and =MMsPn(B$2,B$3,M3,TRUE) in cell O3, highlighting N3:O15, and pressing Ctrl-D. Finally, you can obtain the values in Figure 3 by inserting =MMsW(B$2,B$3,Q3) in cell R3 and =MMsWq(B$2,B$3,Q3) in cell S3, highlighting R3:S15, and pressing Ctrl-D.
Links
Examples Workbook
Click here to download the Excel workbook with the examples described on this webpage.
References
Ross, S. M. (2014) Introduction to probability models, 11th Ed. Academic Press
https://ebin.pub/introduction-to-probability-models-11nbsped-0124079482-9780124079489.html
Sztrik, J. (2021) Basic queueing theory
https://irh.inf.unideb.hu/~jsztrik/education/16/SOR_Main_Angol.pdf
Shores, T. S. (2017) Queueing theory basics and models
No longer available online
Wikipedia (2023) M/M/c queue
https://en.wikipedia.org/wiki/M/M/c_queue
Good day! The expression of pn for n < s contains the error. Variable τ should be raised to the power of variable n, not variable s.
With best wishes, Peter.
Hello Peter,
Thanks for catching this error. I have now corrected this mistake on the webpage.
I appreciate your help in improving the quality of the webasite.
Charles