Basic Concepts
The M/M/1/N queueing model is the same as the M/M/1 model, except that the customer population is finite, with N members.
Properties
Using the notation found in Queueing Theory, we now present formulas for the key properties of this queueing model once a steady state is reached.
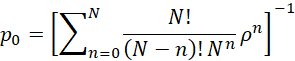
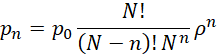
Clearly pn = 0 for n > N, but for n ≤ N, we have
The formulas for L and Lq are


where the obtained mean arrival rate is

We calculate W and Wq using Little’s Law as follows

Example
Example 1: Calculate L, Lq, W, Wq, and pn for the M/M/1/N model with λ, μ, and N specified in column B of Figure 1.
The values for L, Lq, W, Wq, ρ, and λ-bar are calculated on the right side of Figure 1. Column K contains a list of the formulas used in column G. The formula in cell K2 references the formula for p0 shown in Figure 2.

Figure 1 – M/M/1/N queueing model (part 1)
Figure 2 shows how to calculate pn = the probability that n customers are in the system and Pn = the probability that at most n customers are in the system.
We calculate p0 in cell N3 via the formula =1/(FACT(B4)*SUM(R3:R23)). Here, cell R3 contains the formula =IF(Q3<=B$4,G$6^Q3/(FACT(B$4-Q3)*B$4^Q3),0).
The other formulas in column R are inserted by highlighting range R3:R23 and pressing Ctrl-D. The other formulas in column N are inserted similarly by highlighting N4:N23 and pressing Ctrl-D.
Note that column R contains values for n = 0 to 20 (only values n = 0 to 12 are displayed). If N > 20, then we need to expand range R3:R23 to at least n = N.
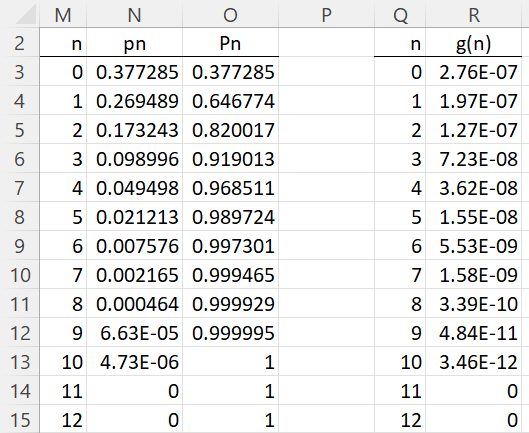
Figure 2 – M/M/1/N queueing model (part 2)
We fill in the other pn values in column N by inserting the formula =N$3*R4*FACT(B$4) in cell N4, highlighting the range N4:N23 and pressing Ctrl-D (rows 16 through 23 are not displayed, although the values in column N are all zero).
Worksheet Functions
Excel Functions: The Real Statistics Resource Pack supports the following array function.
MM1N(λ, μ, nn, lab): returns a column array with the L, Lq, W, Wq, λ-bar in the steady state for the M/M/1/N queueing model with exponential arrival and service rates with mean arrival rate λ and mean service rate μ, and where the population size is nn.
If lab = TRUE (default FALSE), then an extra column of labels is appended to the output. In addition, the following non-array function is also supported.
MM1NPn(λ, μ, nn, n, cum) = pn for the M/M/1/N queueing model defined by nn, λ, and μ if cum = FALSE (default) and = Pn otherwise.
We can obtain the values in range F2:G6 of Figure 1 via the array formula =MM1N(B2,B3,B4,TRUE). We can obtain the values in Figure 2 by inserting =MM1Pn(B$2,B$3,B$4,M3) in cell N3 and =MM1Pn(B$2,B$3,B$4,M3,TRUE) in cell O3, highlighting N3:O15, and pressing Ctrl-D.
Links
Examples Workbook
Click here to download the Excel workbook with the examples described on this webpage.
References
Ross, S. M. (2014) Introduction to probability models, 11th Ed. Academic Press
https://ebin.pub/introduction-to-probability-models-11nbsped-0124079482-9780124079489.html
Sztrik, J. (2021) Basic queueing theory
https://irh.inf.unideb.hu/~jsztrik/education/16/SOR_Main_Angol.pdf
Shores, T. S. (2017) Queueing theory basics and models
No longer available online