Property 1: The best choice for the centroids c1, …, ck are the n-tuples which are the means of the C1, …, Ck,. By best choice, we mean the choices that minimize SSE.
Proof: By calculus, the minimum of SSE is achieved when 
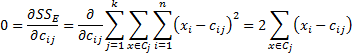
Thus
![]()
and so
![]()
for all i, which means that
![]()
where operations on n-tuples are defined element by element (as for vectors).
References
Kumar, V. (2021) Cluster analysis: basic concepts and algorithms. Introduction to Data Mining
https://www-users.cse.umn.edu/~kumar001/dmbook/ch8.pdf
Pietracaprina, A. (2017) Clustering
https://www.dei.unipd.it/~capri/DM/MATERIALE/Clustering1617.pdf#:~:text=Lemma,arbitrary%20point%20Y%20∈%20<D.
Hi Charles
Can you please explain with a text example too?
If , say I have a dataset of shopping preferences and I am trying to map the preferences as per individual demographic profile, can I employ cluster analysis to do that?
Thanks in advance for your help
Can you give me a more detailed example?
Charles
Hi Charles
Thanks for the cluster analysis example. It was very helpful to understand the mechanics. I tested your cluster example and passed it through Excel SOLVER to determine the cluster number allotment and I did get a diffrent allocation .The allocations is as below:
Cluster
2
2
2
1
1
2
1
1
1
2
with centroids
1 2
X 1.4 4.4
Y 2.6 1.8
and SSE = 20.4
Could there be multiple feasible solutions to clustering algorithm ?
Thanks
Ajeet
Ajeet,
Each time you run the clustering algorithm you can get a different solution. In fact, the solution you came up with is better than the one I found since the value you obtained for SSE is lower.
As described on the website, you should use the k-means++ algorithm to improve your chances of producing a better solution and you should run the algorithm several times and pick the solution that produces the lowest value for SSE.
For many problems, it is not necessary to find an optimal solution, juts one that is good enough.
Charles
Hi Ajeet,
Could you please share your solution to solve the cluster analysis using excel solver. I need it urgently.