Introduction
Excel provides a Data Table capability as one of its What-If Analysis tools. This capability allows you to see how changes to one or two variables affect the output from formulas in a spreadsheet. On this webpage, we describe the two-variable version. See Data Table Facility for a description of the one variable version.
Example 1: Build a two-variable Data Table for f(x,α) = the pdf of the gamma distribution when β = 2.
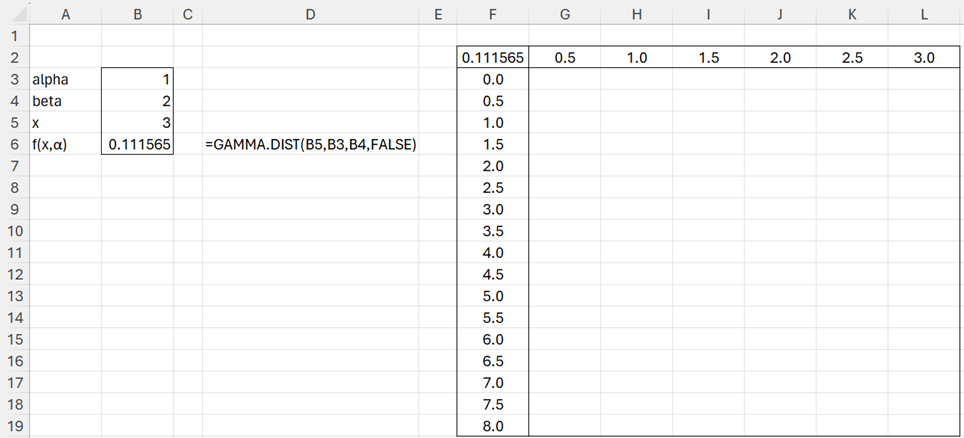
We create a spreadsheet as shown in Figure 1. The column range F3:F19 contains values for x, while the row range G2:L2 contains values for alpha. Cell F2 contains the formula =B6, the cell that contains the formula for f(x,α).
Figure 1 – Data Table Set-up
Data Table dialog box
We next highlight the range F2:L19 and then select Data > What-If Analysis > Data Table… from the ribbon, which brings up the dialog box shown in Figure 1. Fill in this dialog box with the placeholder for alpha, namely B3, in the Row input cell field and the placeholder for x, namely B5, in the Column input cell field.
Output
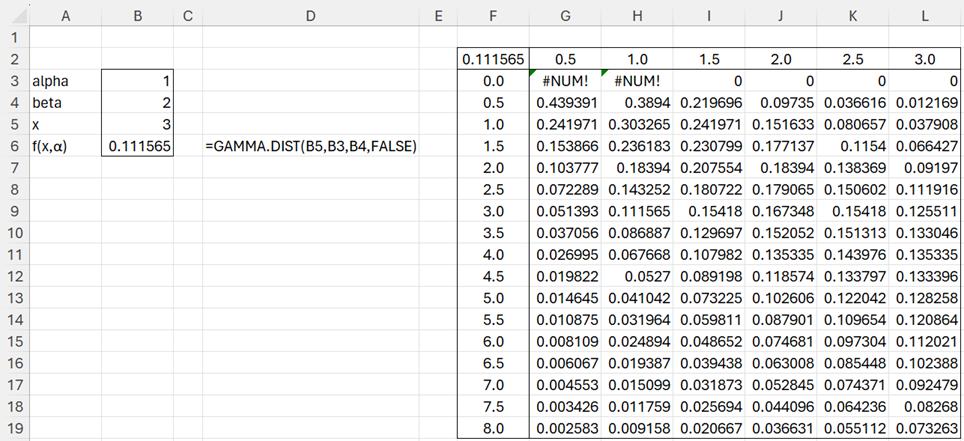
After clicking on the OK button, the result shown in Figure 2 appears.
Figure 2 – Data Table Output
Chart
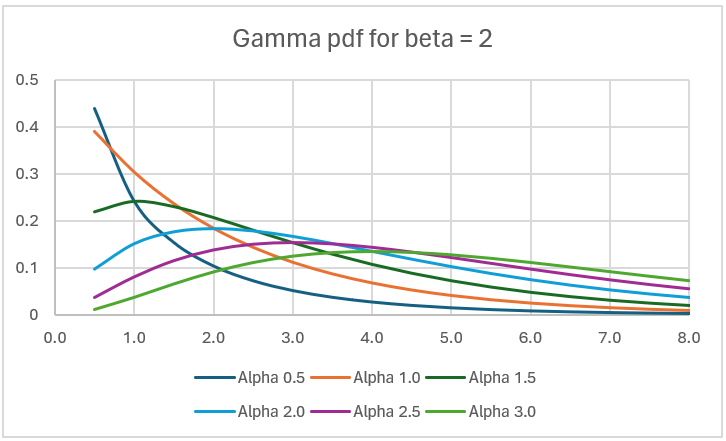
We can create a graph of these results as shown in Figure 3.
Figure 3 – Gamma pdf for beta = 2.0
Examples Workbook
Click here to download the Excel workbook with the examples described on this webpage.
Reference
Cheusheva, S. (2023) How to make and use a data table in Excel.
https://www.ablebits.com/office-addins-blog/data-table-excel-one-variable-two-variable/


