Given a collection of data that may fit the triangular distribution, we would like to estimate the parameters which best fit the data. We illustrate the method of moments approach on this webpage. Click here to see another approach, using the maximum likelihood method.
Using Equations
Given a data set X with elements x1, …, xn, our objective is to estimate the parameters of a triangular distribution that best fits the data set.
The triangular distribution has three parameters a < b < c. Clearly
a ≤ min X max X ≤ c
We now show two cases.
Estimating b from a and c
If you know the values of a (the left end-point) and c (the right end-point) parameters, then you can use these values to estimate b (the mode) based on the formula for the mean m, namely
m = (a + b + c)/3
Hence
b = 3m – a – c
Alternatively, you can estimate b using the median md instead of the mean based on the formula for the median shown in Triangular Distribution. In this case
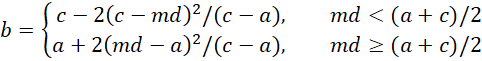
To ensure that b is in the interval (a, c) when you use the median to estimate b, you must make sure that
![]()
Often, if a and c are not known, we use the estimates
a = min X c = max X
As we observed in Fitting a Triangular Distribution via MLE, these are usually not the best estimates.
Example
Example 1: Fit the data in range B2:G11 of Figure 1 to a triangular distribution using the method of moments when we know that a = 1.017428 and c = 3.549628.
We only need to estimate the value of b. This is shown in Figure 1. The value for b in cell R3 is found by using the formula for the mean. The value for b in cell R9 is found by using the formula for the median.
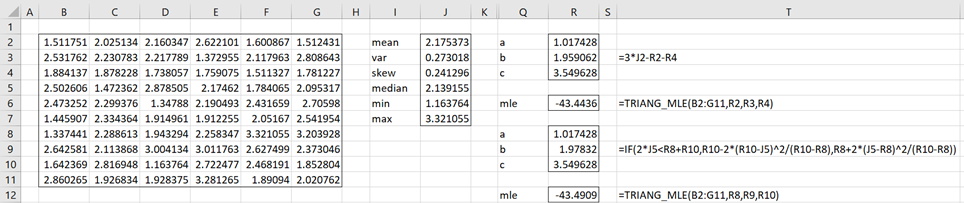
Figure 1 – When a and c are both known
The LL values shown in cells R6 and R12 are calculated using the TRIANG_MLE function described in Fitting a Triangular Distribution via MLE.
Estimating c and b from a (or a and b from c)
If you know the value of a, then you can estimate b and c based on the sample mean m and sample variance v using the following property.
m = (a + b + c)/3
v = (a2 + b2 + c2 – ab – ac – bc)/18
Property 1: If you know the value of a then you can estimate b and c by
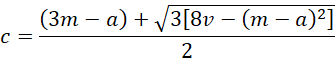
b = 3m – a – c
Proof: Click here for the proof.
Property 2: If you know the value of c then you can estimate a and b by
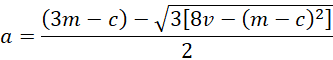
b = 3m – a – c
Proof: The proof is similar to that of Property 1.
Example
Example 2: (a) Fit the data in range B2:G11 of Figure 1 to a triangular distribution using the method of moments when we know that a = 1.017428 (as in cell M2 of Figure 3). (b) Fit the data if, instead, we know that c = 3.549628 (as in cell M4 of Figure 2.
For (a), we need to find the values of b and c. This is shown in cells M3 and M4 of Figure 2. For (b), the estimates for a and b are shown in cells M8 and M9 of Figure 2.
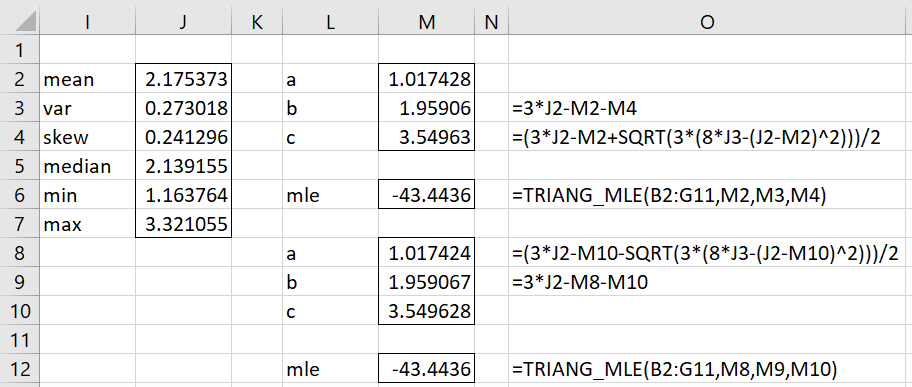
Figure 2 – When a or c is known
The LL values shown in cells M6 and M12 are calculated using the TRIANG_MLE function described in Fitting a Triangular Distribution via MLE.
Estimating all three parameters
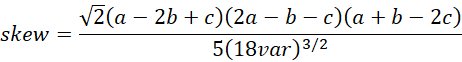
If we don’t know the value of any of the parameters, we can use the skewness w of the data in X, along with the mean m and variance v to estimate all three parameters.
The triangular distribution mean, variance, and skewness are
![]()
![]()
If the m, v, and w are the mean, variance, and skewness of the sample, as calculated from the X data in R1 via the formulas =AVERAGE(R1), =VAR.S(R1), and =SKEW(R1), then we can estimate the a, b, and c parameters by setting mean = m, var = v, and skew = w. One way to accomplish this is by trying to minimize
sumsq = (mean – m)2 + (var – v)2 + (skew – w)2
The smaller the value of sumsq, the better the fit. We can use Excel’s Solver to accomplish this.
Solver Example
Example 3: Use Excel’s Solver to fit the data in range B2:G11 of Figure 3 to a triangular distribution using the method of moments.
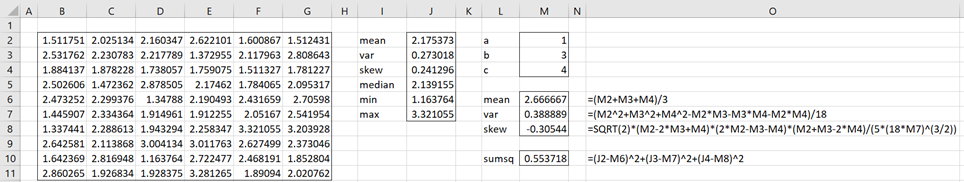
Figure 3 – Initializing Solver
To accomplish this, select Data > Analyze|Solver, and fill in the dialog box shown in Figure 4.
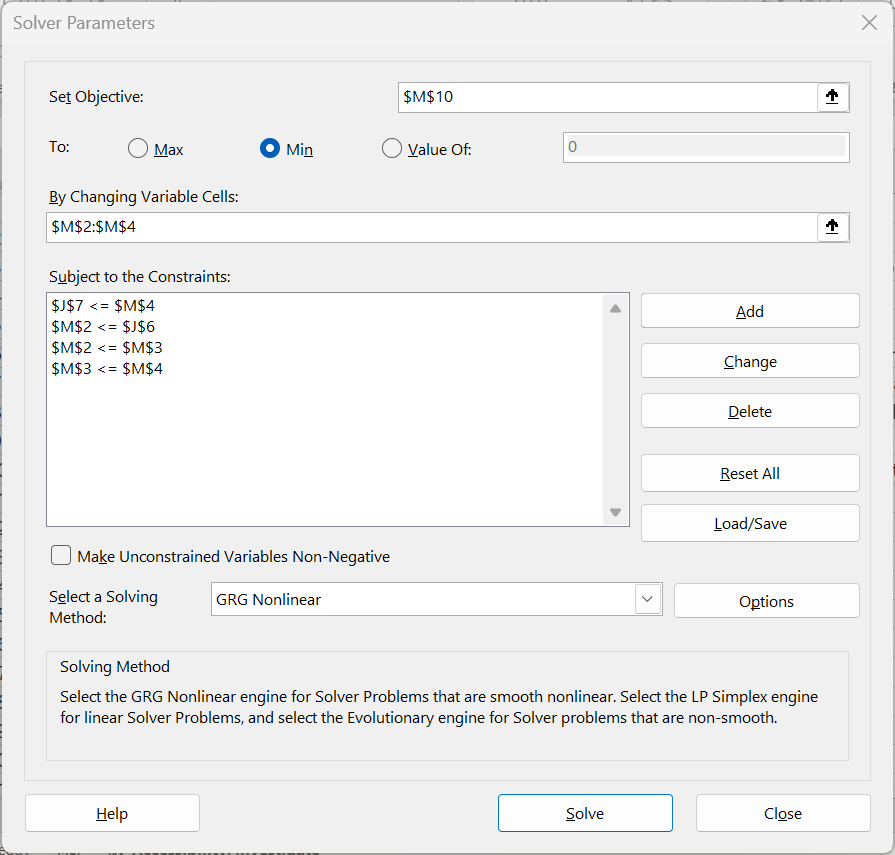
Figure 4 – Solver dialog box
After clicking on the Solve button, the results shown in Figure 5 appear.
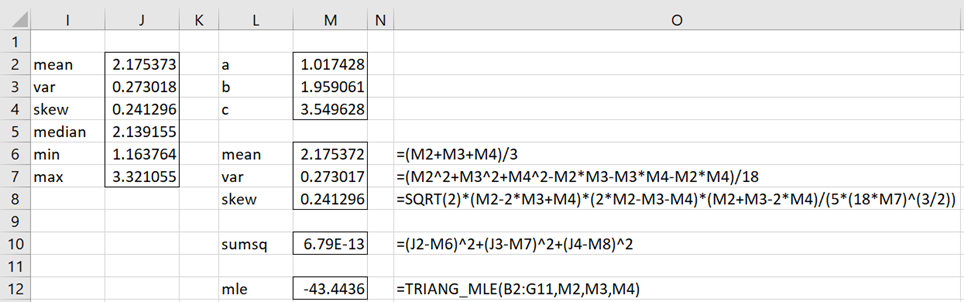
Figure 5 – Solver results
The estimated values for a, b, and c are shown in M2:M4. Note that the values shown in J2:J4 are almost identical to those in M6:M8. The log-likelihood value for these values of a, b, and c are shown in cell M12, as described in Fitting a Triangular Distribution via MLE.
Using Iterative Search
We can also estimate the parameter values by iterative search in the same manner as for the triangular distribution. For more details see Triangular Distribution MoM Support.
Examples Workbook
Click here to download the Excel workbook with the examples described on this webpage.
References
Cook, J. (2015) Fitting a triangular distribution
https://www.johndcook.com/blog/2015/03/24/fitting-a-triangular-distribution/#:~:text=One%20way%20to%20fit%20a,if%20these%20values%20are%20known.
Kotz, S., van Dorp, R.(2004) The triangular distribution. Beyond Beta
https://books.google.it/books/about/Beyond_Beta_Other_Continuous_Families_Of.html?id=JO7ICgAAQBAJ&redir_esc=y