As for Randomized Complete Block Design, described in Follow-up RCBD Testing, the Latin Squares data analysis tool provides support for two follow-up tests: Contrasts and Tukey HSD.
Contrasts
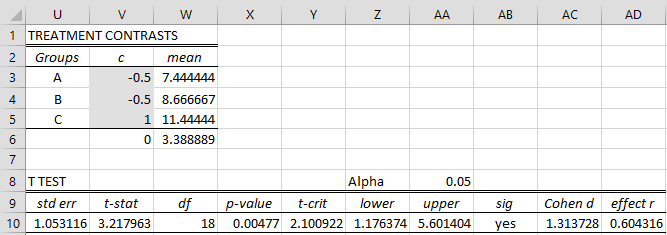
Example 1: As we see from Figure 1 of Latin Squares with Replication, there is a significant difference between the treatments in Example 1 of Latin Squares with Replication. Use contrasts to determine whether there is a significant difference between treatment C and the average of treatments A and B.
You can accomplish this analysis, by choosing the Latin Squares data analysis tool and checking the Contrasts option on the dialog box as shown in Figure 1 of Latin Squares Tools. After filling in the contrast coefficients in range V3:V5 of Figure 1, we get the following analysis.
Figure 1 – Contrasts for Latin Square design
We see from cell AB10 that there is a significant difference between treatment C and the average of treatments A and B.
Cell U10 contains the formula =SQRT(P9*SUMSQ(V3:V5)/((O5+1)*(O6+1))), cell W10 contains the formula =O9 and cell X10 contains the formula =T.DIST.2T(ABS(V10),W10). Many of the other formulas in Figure 1 are similar to those in Figure 3 of RCBD Follow-up Testing.
Tukey’s HSD
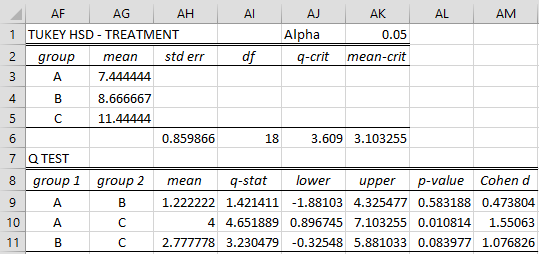
Example 2: Use Tukey’s HSD to determine which pairs of treatments from Example 1 have significantly different yields.
You can accomplish this analysis, by choosing the Latin Squares data analysis tool and checking the Tukey’s HSD option on the dialog box as shown in Figure 1 of Latin Squares Tools to obtain the output displayed in Figure 2.
Figure 2 – Tukey’s HSD for Latin square design
Figure 2 shows that treatments A and C have significantly different yields, while other comparisons are not significant.
Examples Workbook
Click here to download the Excel workbook with the examples described on this webpage.
References
Montgomery, D. C. (2012) Design and analysis of experiments. 8th ed. Wiley
https://faculty.ksu.edu.sa/sites/default/files/douglas_c._montgomery-design_and_analysis_of_experiments-wiley_2012_edition_8.pdf
Zhang, M. (2015) Latin Squares and Related Designs
https://www.stat.purdue.edu/~minzhang/514-Fall2015/lec%20notes_files/Lec7-latinsquare.pdf

