Statistical Power
To calculate the power of a two-sample correlation test (using the Fisher transformation), you need to follow the steps in the following example based on the formulas
![]()
Example 1: Find the power for a two-sample correlation test for null hypothesis ρ1 = ρ2 based on samples of sizes 50 and 60 with corresponding correlation coefficients .65 and .85.
We see from Figure 1 that the power is 68.46%.
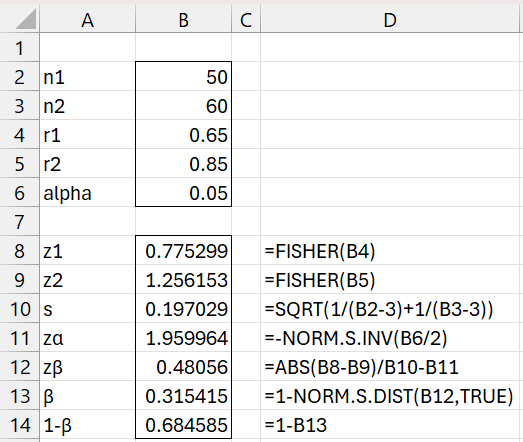
Figure 1 – Power estimation
Worksheet Function
The Real Statistics Resource provides the following worksheet function.
CORREL2_POWER(r1, r2, n1, n2, tails, α) = power for the two-sample correlation test where one sample has size n1 and correlation r1, and the other has size n2 and correlation r2.
tails = 1 or 2 (default). α = significance level (default .05).
For Example 1, we can obtain the power shown in cell B14 using the formula =CORREL2_POWER(B4, B5, B2, B3, 2, B6).
Sample Size
We can estimate the minimum sample size required to achieve a specified power by using the following formula
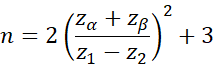
Here n = the size of each of the samples.
Example 2: Estimate the minimum sample size required to achieve power of .90 for a two-sample correlation test where the samples have correlations .65 and .85, and we assume that the samples have the same size.
We see from Figure 2 that each sample must be of size 94 to achieve 90% power.
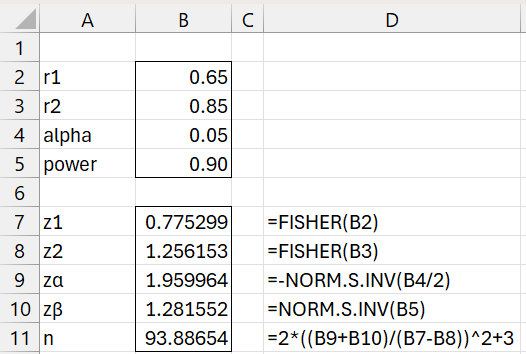
Figure 2 – Minimum sample size
One fixed sample size
This calculation assumes that both samples have the same size. If instead we assume that the first sample has fixed size n1, then the size of the other sample can be expressed as
assuming that n is the harmonic mean of n1 and n2 where n is as described above.
Example 3: If we only have the funds for a sample of size 80 for the first sample, how big does the other sample need to be to achieve 90% power?
We see from Figure 3 that the second sample must have size of at least 114.
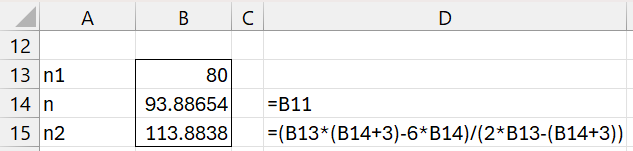
Figure 3 – Sample size with fixed value for one sample
Note that if the fixed value is set too low, the formula will return a negative value, indicating that the specified level of power can’t be achieved. E.g. if n1 = 49 then n2 = 3758, but if n1 = 48 then n2 = -4610. This indicates that even with extremely large values of n2, power near .90 can be achieved but not .90 or greater.
Unequal sample sizes
Example 4: Repeat Example 2 where we assume that the second sample is 20% larger than the first sample.
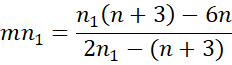
Here we are requesting that n2 = m*n1 where m = 1.2. It turns out that in this case
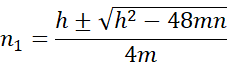
where h = (m+1)(n+3).
For Example 4, we see that n1 = 87 and n2 = 104, as shown in Figure 4. n1 < n < n2 as expected. We see that the values calculated using the negative of the square root don’t have this property and are rejected.
Figure 4 – Sample size calculation
Note that since we had to round up the n1 and n2 values, it is possible that we only need to round up only one of these values. In fact, as we can see from Figure 5, it is sufficient to use that n1 = 86 and n2 = 104,
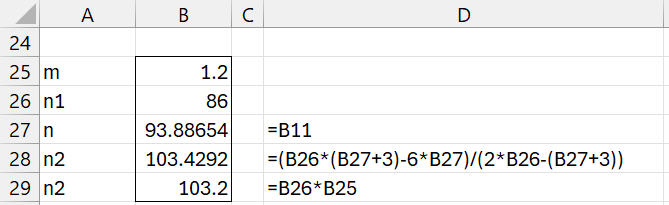
Figure 5 – Revised sample size calculation
Proof of unequal sample size
When n2 = m*n1 where m = 1.2, we see that by the property used when we have one fixed sample size
Solving for n1, where k = n+3, we get
![]()
![]()
![]()
Using the quadratic formula
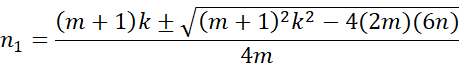
which is equivalent to
Worksheet Function
The Real Statistics Resource provides the following worksheet function.
CORREL2_SIZE(r1, r2, pow, ratio, tails, α) = size of the second sample for a two-sample correlation test with correlations r1 and r2 when the goal is to achieve power of pow (default .80).
tails = 1 or 2 (default). α = significance level (default .05). If ratio = 1 (default) then both samples have the same size. If ratio > 0 then the size of sample 2 = ratio times the size of sample 1. If ratio < 0 then the size of sample 1 = –ratio.
For Example 2, the formula =CORREL2_SIZE(B2, B3, B5) returns the same value as found in cell B11 of Figure 2. The formula =CORREL2_SIZE(B2, B3, B5,-B13) returns the same value as found in cell B15 of Figure 3. Finally, the formula =CORREL2_SIZE(B2, B3, B5, B17 return the same value as found in cell B21 of Figure 4.)
Examples Workbook
Click here to download the Excel workbook with the examples described on this webpage.
References
Zar, J. H. (2010) Biostatistical analysis 5th Ed. Pearson
Howell, D. C. (2010) Statistical methods for psychology (7th ed.). Wadsworth, Cengage Learning.
https://labs.la.utexas.edu/gilden/files/2016/05/Statistics-Text.pdf
NCSS (2023) Tests for two correlations
https://www.ncss.com/wp-content/themes/ncss/pdf/Procedures/PASS/Tests_for_Two_Correlations.pdf