Point-biserial correlation
Property 1: If {y1, …, yn} is a sample for the dichotomous random variable y and {x1, …, xn} is a sample for the random variable x, the point-biserial correlation coefficient between these samples can be expressed by the formula
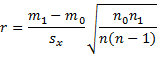
where m0 is the mean of the n0 data elements xi whose corresponding y value is yi = 0, m1 is the mean of the n1 data elements xi whose corresponding y value is yi = 1, and sx is the (sample) standard deviation of {x1, …, xn}.
Proof: First note that
![]()
When yi = 0, then yi – y-bar = – n1/n, and when yi = 1, then yi – y-bar = 1 – n1/n = – n0/n. Thus
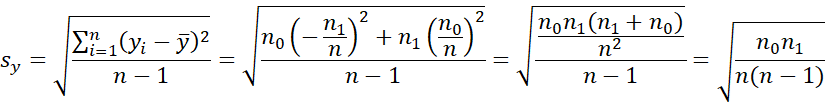
Rearranging the terms so that the first n1 values of xi correspond to yi = 1, we have
![]()
![]()
![]()
Using these results, it follows that
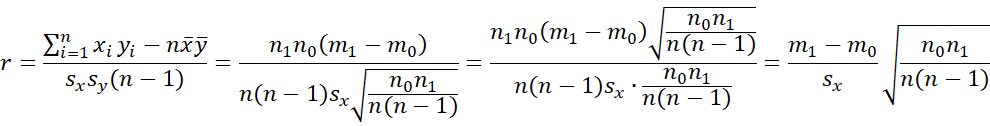
The proof of the population version of this property is similar.
r-effect size
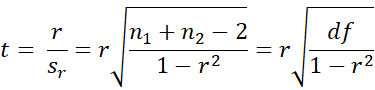
Property 2:
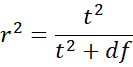
where t is the test statistic for two means hypothesis testing of variables x1 and x2 with t ~ T(df), x is a combination of x1 and x2, and y is the dichotomous variable as in Example 1.
Proof: By Property 1 of Correlation Testing via t Test and the fact that df = n–2, we see that
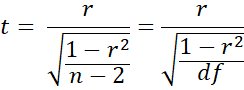
Squaring both sides of the equation and solving for algebraically yields the desired result.
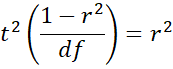
t2 – t2r2 = r2df
t2 = r2(t2+df)
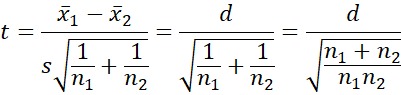
Property 3: Assuming the two populations have the same variance
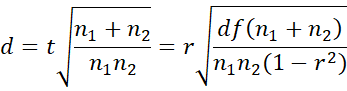
Proof: The first equality holds since by Property 1 of Two-sample t Test with Equal Variances
The last equality follows by By Property 1 of Correlation Testing via t Test since
References
Wikipedia (2012) Point-biserial correlation coefficient
https://en.wikipedia.org/wiki/Point-biserial_correlation_coefficient
DATAtab (2024) Point-biserial correlation
https://datatab.net/tutorial/point-biserial-correlation
StatisticsLectures (2012) Effect size for dependent samples t-test
http://www.statisticslectures.com/topics/effectsizedependentsamplest/