Objectives
We describe how to extend the Contrasts described in Bayesian Contrasts to handle models with both between-subjects and within-subject factors. We then use Bayesian Signed Ranks and Mann-Whitney tests to perform statistical analyses.
Example
Example 1: We ran an experiment for a mosquito repellent with three formulations: low, medium, and high concentrations. Five people are randomly assigned to each of the formulations, and the number of bites on each person’s neck, arm, and foot were recorded over the course of a day in a heavily infested area, as shown in Figure 1.
(a) Test whether the repellent is more effective on the arm or neck than on the foot.
(b) Also test whether overall the high concentration formulation is better than the others.
(c) Finally, test whether the low/high formulations are better on the arm or on the foot.
The analysis for (a) is shown in Figure 1.
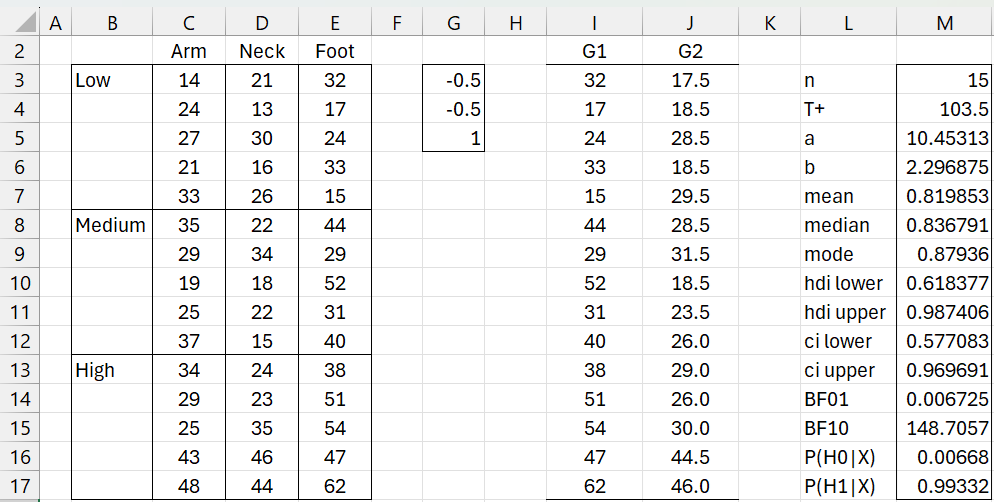
Figure 1 – Mosquito analysis – test (a)
Here we used the array formula =Contrast(C3:E17,G3:G5) in range I3:J17 to create the contrast and then the array formula =BayesSRLg(I3:I17-J3:J17,TRUE) to perform the analysis. We see that BF10 = 148.7 provides decisive support in favor of the alternative hypothesis that the repellent is more effective on the foot than on the other tested parts of the body.
To perform the analysis for (b) and (c) requires some new contrast worksheet functions, as described below.
Between-Subjects Testing
Worksheet Function
The Real Statistics Resource Pack provides the following worksheet function where R1 contains data in the Excel format used for two-factor ANOVA without headings. Here, we assume that columns are used for a within-subjects factor and rows are used for a between-subjects factor.
If R1 is an m × n array and each row factor contains nrows rows, then Rr is a k × 1 contrast array where k = m/nrows. Entries are restricted to 1, -1 or 0 (or blank). The entries don’t need to sum to 0.
Rc is a n × 1 “contrast” array whose entries are numeric weights. There are no restrictions (although usually only non-negative values are used).
CONTRAST3(R1, Rr, Rc, nrows): outputs an array with two columns. The first column corresponds to the positive contrast coefficients in Rr and the second column corresponds to the negative contrast coefficients in Rr. Rc is used to create a weighted sum of the column values in R1.
Example
This function can be used with the Bayesian Mann-Whitney test to provide the analysis for test (b), as shown in Figure 2.
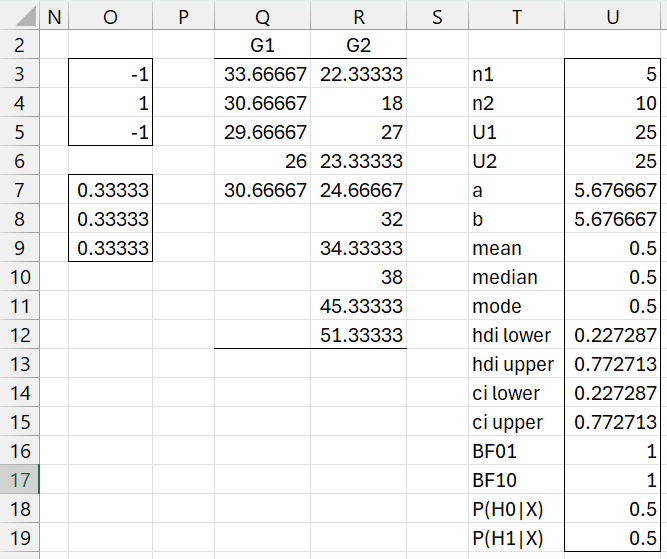
Figure 2 – Mosquito analysis – test (b)
Here we used the array formula =Contrast3(C3:E17,O3:O5,O7:O9,5) in range Q3:R12 to create the contrast and then the array formula =BayesMWLg(Q3:Q7,R3:R12,TRUE) to perform the analysis. We see that BF10 = 1 provides no evidence in favor of either hypothesis.
Within-Subjects Testing
Worksheet Function
The Real Statistics Resource Pack provides the following worksheet function where R1 contains data in the Excel format used for two-factor ANOVA without headings. Here, we assume that columns are used for a within-subjects factor and rows are used for a between-subjects factor.
If R1 is an m × n array and each row factor contains nrows rows, then Rr is a k × 1 “contrast” array where k = m/nrows. Entries are restricted to 1 or 0 (or blank).
Rc is a n × 1 contrast array whose entries need to sum to 0.
CONTRAST4(R1, Rr, Rc, nrows): outputs an array with two columns. The first column corresponds to the positive contrast coefficients in Rc and the second column corresponds to the negative contrast coefficients in Rc. Rr is used to determine which rows from R1 are included in the analysis.
Example
This function can be used with the Bayesian Signed Ranks test to provide the analysis for test (c), as shown in Figure 3.
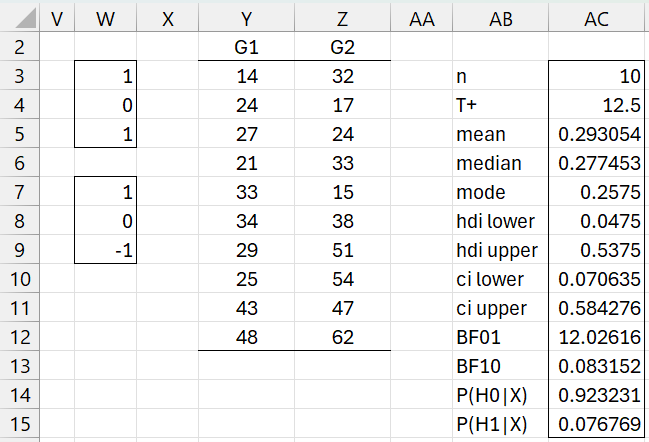
Figure 3 – Mosquito analysis – test (c)
Here we used the array formula =Contrast3(C3:E17,W3:W5,W7:W9,5) in range Q3:R12 to create the contrast and then the array formula =BayesSRSm(Y3:Y12,Z3:Z12,TRUE) to perform the analysis. We see that BF01 = 12 provides some evidence in favor of the hypothesis that the low/high versions of the repellent are more effective on the foot than on the arm.
Examples Workbook
Click here to download the Excel workbook with the examples described on this webpage.
References
Chechile, R. A., Barch, D. H. Jr. (2025) Distribution-free Bayesian analyses with the DFBA statistical package
https://link.springer.com/article/10.3758/s13428-025-02605-6
Chechile, R. A. (2019) A Bayesian analysis for the Mann-Whitney statistic
https://doi.org/10.1080/03610926.2018.1549247