Objectives
We describe how to extend the Bayesian Signed Ranks and Mann-Whitney tests to more than two samples by using contrasts.
Repeated Measure Contrasts
Worksheet Function
The Real Statistics Resource Pack provides the following worksheet function where R1 contains data for three or more samples where each column contains the data for one sample. R2 is a contrast vector containing as many entries as columns in R1. The entries in R2 must add up to zero.
CONTRAST(R1, R2): outputs an array with two columns and the same number of rows as in R1. The first column corresponds to the positive contrast coefficients in R2 and the second column corresponds to the negative contrast coefficients.
This function can be used with the Bayesian Signed Ranks test.
Examples
Example 1: Given 12 subjects, each of whom is measured 4 times (labelled A, B, C, D), as shown in range A1:D13 of Figure 1 (with means shown in row 14) determine test whether the D mean is greater than the average of the means for A, B, and C.
We set the contrasts as shown in range F2:F5. Using the array formula =CONTRAST(A2:D13,F2:F5) we obtain the output shown in range H2:I13. We see decisive support for the alternative hypothesis (BF10 = 175.6) as shown on the right side of the figure, using the array formula =BayesSRSm(I2:I13-H2:H13,TRUE).

Figure 1 – Contrasts for repeated measures analysis
We can also use contrasts to compare two samples, as shown in Figure 2.
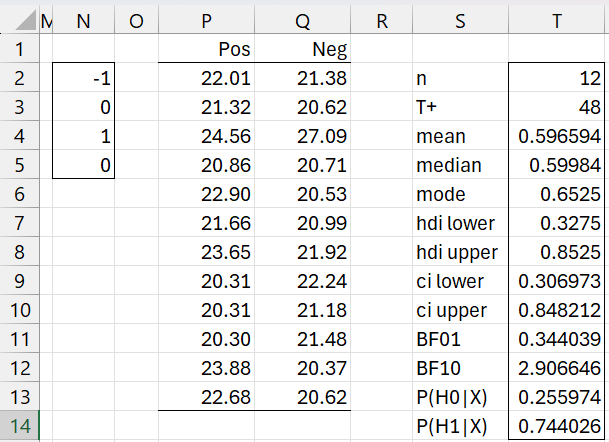
Figure 2 – Simpler example
Between-subjects Contrasts
Worksheet Function
The Real Statistics Resource Pack provides the following worksheet function where R1 contains data for three or more samples and each column contains the data for one sample. R2 is a “contrast” vector containing as many entries as columns in R1. Entries are restricted to 1, -1 or 0 (or blank). The entries don’t need to sum to 0.
CONTRAST1(R1, R2): outputs an array with two columns. The first column corresponds to the +1 contrast coefficients in R2 and the second column corresponds to the -1 contrast coefficients.
The two columns in the output don’t need to have the same number of entries.
This function can be used with the Bayesian Mann-Whitney test.
Example 2: Given 4 independent samples of 12 entries corresponding to the results of 4 different treatments, as shown in Figure 3, determine whether treatment C is more effective than the treatment provided to the subjects in treatment groups A and B.
This time we use the “contrasts” in column F, and insert the formula =CONTRAST1(A2:D14,F2:F5) in range H2:I25.

Figure 3 – Extending the Mann-Whitney test
The test results are shown in range K2:I18 using the array formula =BayesMWLg(H2:H13,I2:I25,TRUE). We see there is fairly minimal support for the alternative hypothesis (BF10 = 3.24).
Interactions
Worksheet Function
The Real Statistics Resource Pack provides the following worksheet function where R1 contains data in the Excel format used for two-factor ANOVA without headings. If R1 is an m × n array and each row factor contains nrows rows, then R2 is a k × n “contrast” array where k = m/nrows. Entries are restricted to 1, -1 or 0 (or blank). The entries don’t need to sum to 0.
CONTRAST2(R1,R2, nrows): outputs an array with two columns. The first column corresponds to the +1 contrast coefficients in R2 and the second column corresponds to the -1 contrast coefficients.
The two columns in the output don’t need to have the same number of entries.
This function can be used with the Bayesian Mann-Whitney test.
Examples
We repeat the some of the examples used in Contrasts for Two Factor ANOVA with Replications. The data is repeated in range B2:E17 of Figure 4.
Example 3: Compare the main effects of the Humid versus Cold.
We use the contrasts shown in G3:I5 to obtain the two column result shown in range K3:K17 by using the array formula =CONTRAST2(B3:E17,G3:I5,5).
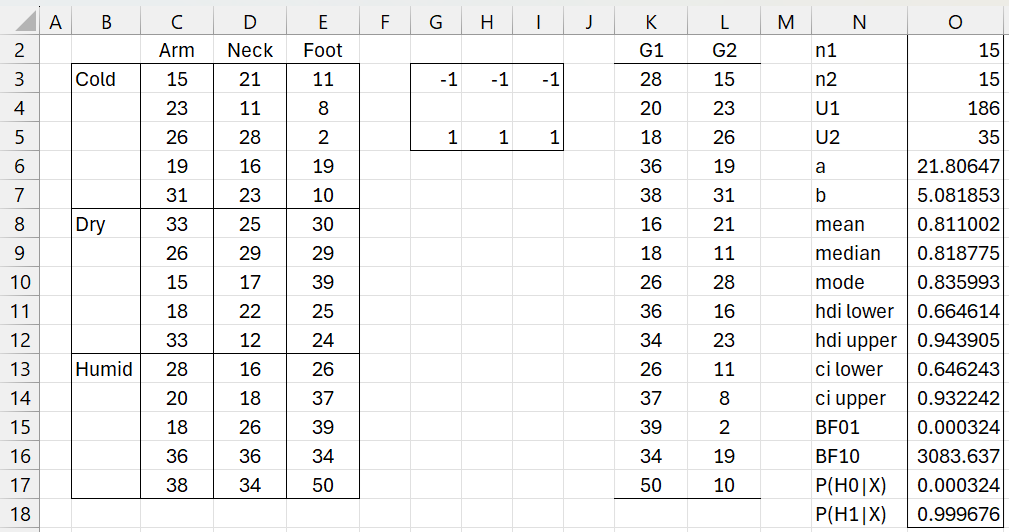
Figure 4 – Cold vs. Humid
We next use the formula =BayesMWLg(K3:K17,L3:L17,TRUE) to obtain the analysis shown in range N2:O18. We see overwhelming support for the alternative hypothesis with BF10 = 3084.
Example 4: Compare the effects of the Humid × Arm versus Humid × Foot.
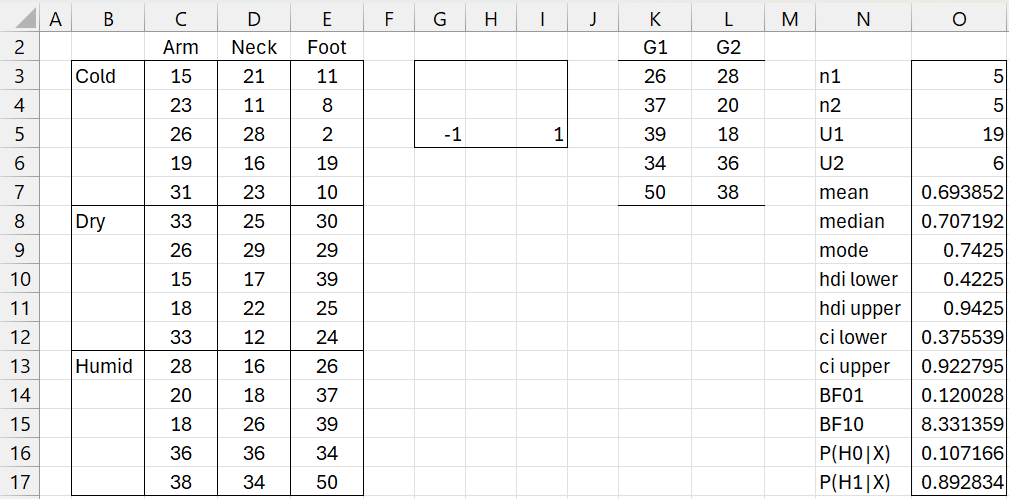
Figure 5 – Humid/Arm vs. Humid/Foot
Example 5: Compare the effects of the Humid vs. Cold for Arm/Neck
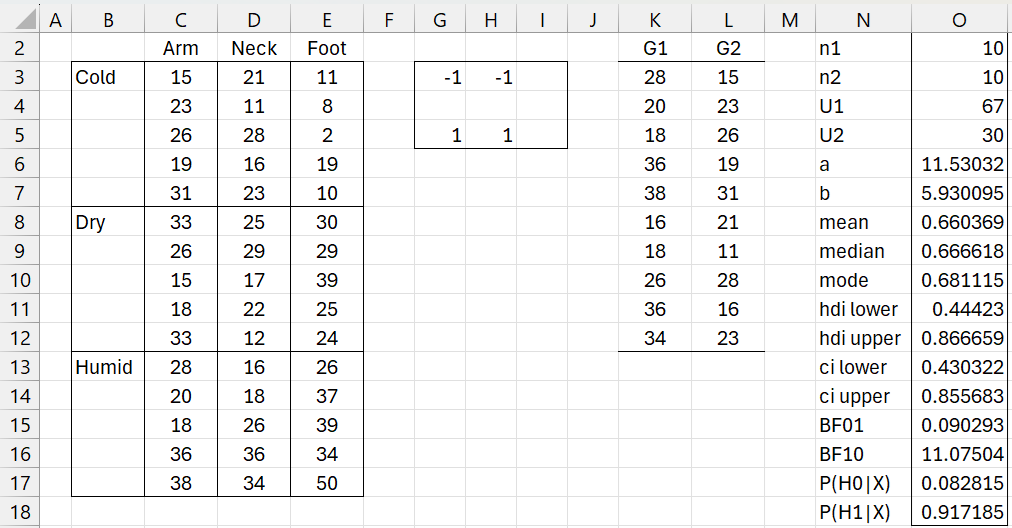
Figure 6 – Humid vs. Cold for Arm/Neck
Example 6: Finally, we note that in a 2 × 2 factor design such as that shown in range B3:C16, if we use the contrasts shown in B18:C19 to obtain the design shown in range V3:W16, then the role of columns and interaction are exchanged in the ANOVA results shown in columns J through P.
In a similar way, we can use the Mann-Whitney analysis shown in range AL:AM19, using =BayesMWLg(W3:W16, V3:V16,TRUE), to model the interaction of the factors in the original design.
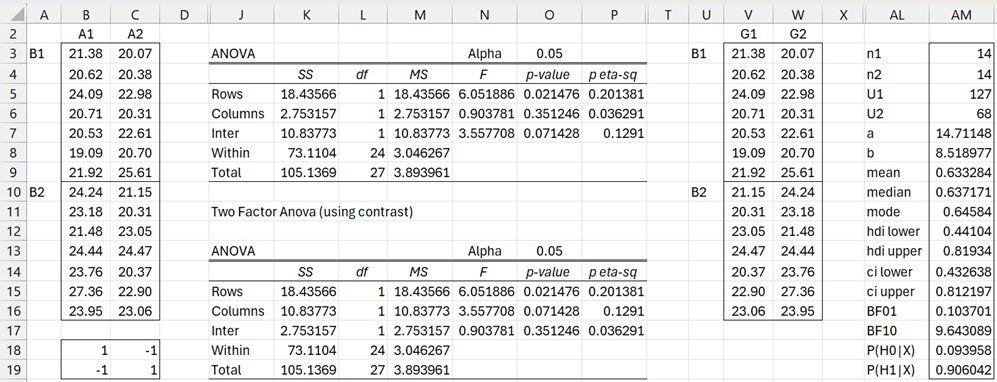
Figure 7 – Bayesian Interaction via MW Test
Mixed Model Contrasts
Click here for information about using contrasts for analysis of models that have one between-subjects factor and one within-subjects factor.
Examples Workbook
Click here to download the Excel workbook with the examples described on this webpage.
References
Chechile, R. A., Barch, D. H. Jr. (2025) Distribution-free Bayesian analyses with the DFBA statistical package
https://link.springer.com/article/10.3758/s13428-025-02605-6
Chechile, R. A. (2019) A Bayesian analysis for the Mann-Whitney statistic
https://doi.org/10.1080/03610926.2018.1549247