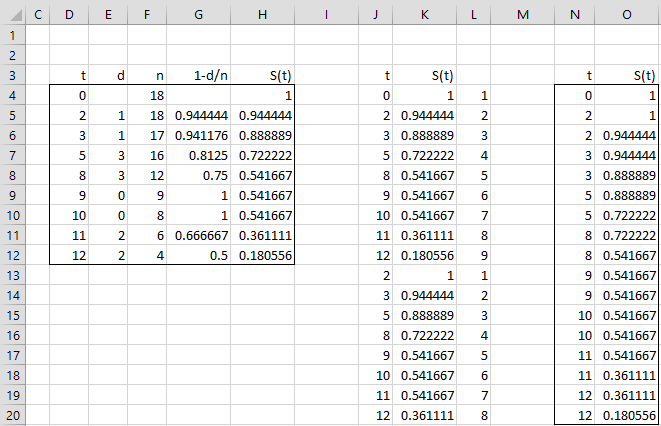
We now show how to create a step chart for the S(t) values in Example 1 of Kaplan-Meier Overview. First, we copy the values in columns D and H to the range J3:K12, as shown in Figure 1. Next, we put the values 1 through 9 in column L. We then copy range J5:J12 to range J13:J20 and copy range K4:L11 to K13:L20. We next sort range J3:L20 using Excel’s Data > Sort & Filter|Sort (we can then remove the values in column L since they are no longer needed). Alternatively, we can use the Real Statistics QSORTRows array function to achieve the same result, as shown in range N3:O20 of Figure 1.
Figure 1 – Creating a Kaplan-Meier Curve
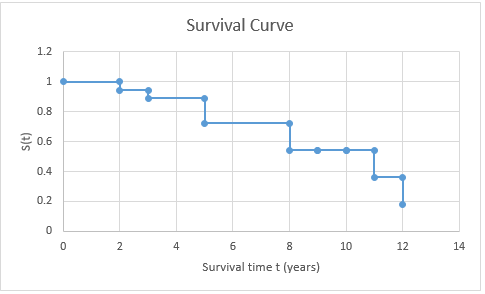
We can now highlight range N3:O20 and select Insert > Charts|Scatter, using the Scatter with Straight Lines and Markers option. After the usual modifications to the titles, we obtain the step chart shown in Figure 2.
Figure 2 – Kaplan-Meier Curve
Also, see Real Statistics Support for Kaplan-Meier for a simpler way to produce the survival curve.
Examples Workbook
Click here to download the Excel workbook with the examples described on this webpage.
Reference
Sullivan, L. (2016) Estimating the survival function
https://sphweb.bumc.bu.edu/otlt/MPH-Modules/BS/BS704_Survival/BS704_Survival4.html


The biggest “wow” moment for me is that you don’t just teach the theory—you hand us a ready-to-use Excel workbook that produces publication-ready Kaplan-Meier plots with risk tables and confidence bands. It feels like getting a free, pocket-sized survival-analysis machine that runs on a software everyone already has. Huge thanks for democratizing advanced stats!
Thank you very much, Orca.
I appreciate your comment and your support.
Charles
Dear Dr. Zanoit, I have a problems when I want to make que survival curve in Excel, it shows a window which say the Column 1 of imput range 1 must only contain positive number, but they are all positive numbers. Is there any solution?
Hello Sofia,
Often this sort of message indicates some confusion regarding column headings. This may not be the problem in your case though.
If you send me an email with an Excel spreadsheet containing your data, I will try to figure out what has gone wrong.
Charles
I just want to check that this is correct.
S(t) is the cumulative survival to time t. So if t is an time or age class, S(t) is survival to the beginning of time or age t.
But in your example, you have S(2) = 0.944 because of the death events in time/age class 2. But there were no death events before age 2, so should not S(2) be 1.0? And the death events be used to calculate S(3)?
Hello Jonathan,
S(t) is the survival to the end of time t, not the beginning of time t.
I don’t see any reason why you couldn’t define it differently, but this is the way I have defined it.
Charles