On this webpage, we use the notation found at Estimating the Cox Regression Coefficients using Solver.
The Cox regression model takes the form
![]()
where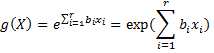
Property 1: An estimate of h0(tj) for any j = 1, …, m (due to Kalbfleisch and Prentice) is:
![]()
where cj is a solution to the equation
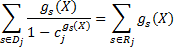
In the general case, this equation must be solved by iterative means (e.g. Newton’s Method or Solver), but in the case where dj = 1 for all j, by simple algebra we get
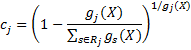
Property 2: The following is an estimate for cj:
![]()
Observation: The estimate for cj from Property 2 can be used as the initial guess when using any of the iterative methods to solve the equation in Property 1.
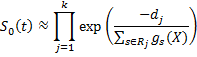
The quantity cj is an estimate of the probability that a subject survives from tj to tj+1, and so the estimated baseline survival function is

for any t in the interval tk ≤ t < tk+1 for any k = 1, …, m-1. S0(t) = 1 for t < t1. If there are no censored times ≥ tm, then S0(t) = 0 for t ≥ tm. Otherwise, let te = the largest censored time. Then for any t in the interval tm ≤ t < te, then S(t) = 
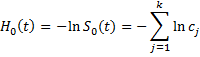
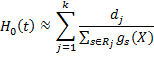
By Property 1 of Survival Analysis Basic Concepts, the baseline cumulative hazard function is
By Property 2, the following property follows.
Property 3:
References
Kalbfleisch, J. D., Prentice, R. L. (2002) The statistical analysis of failure time data. 2nd Ed. Wiley
https://books.google.it/books/about/The_Statistical_Analysis_of_Failure_Time.html?id=BR4Kq-a1MIMC&redir_esc=y
what’s the intuition behind property1? c_j is # of true death / probability of death for all at risk samples at time_j?
I am sorry, but I haven’t thought about Property 1 enough to be able to provide any intuition. Perhaps the reference on the webpage would provide this.
Charles
Thank you very much, Professor
Hello Charles,
Would it be possible to add an example for this?
Many thanks,
Rodrigo,
Yes, I plan to add an example of the baseline hazard function.
Charles
Hi Charles,
Regarding baseline function of Ho and cumulative hazard function, please help to explain example with figures and how to set up in excel.
Thanks, Gabriel
Hello Gabriel,
I have received your email with an example from SAS that you would like to see duplicated in Excel. Do you have a reference for how the data to be graphed was generated by SAS?
Charles
Hi Charles,
Currently, I am learning the probability of loan for credit impairment. I don’t have any data reference. I want to learn Cox here, and how to apply “Estimating the Baseline Hazard Function”. Thus would appreciate you could provide example and guideline in excel.
Thanks,
Hello Gabriel,
Ok. I don’t have an example in Excel and would need to create such an example.
Charles
Indeed, it would be nice if there was an example for the calculation of the “Baseline Hazzard Function” in the “Examples worbooks”.
Best regards, Roberto.
Hello Roberto,
Yes, this is an excellent idea. I had hoped to do this a long time ago but still haven’t managed to turn my attention to it.
I will work on this after I finish updating the website and examples workbooks for compatibility with Rel 8.0.
Charles