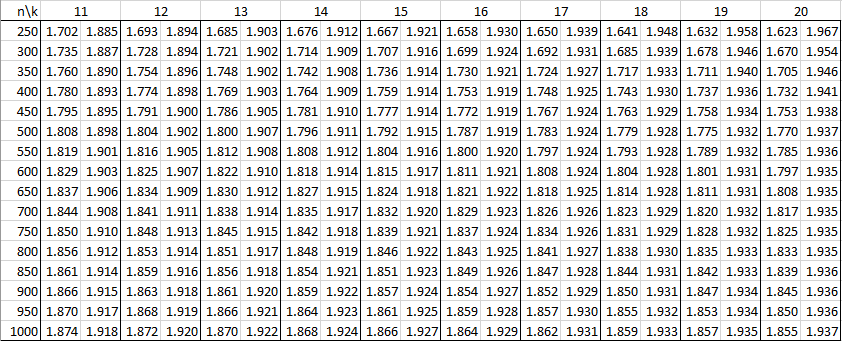
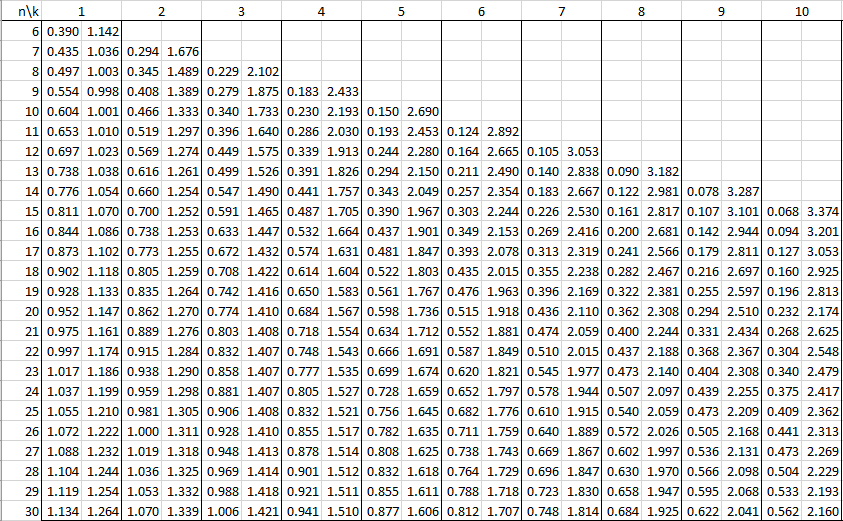
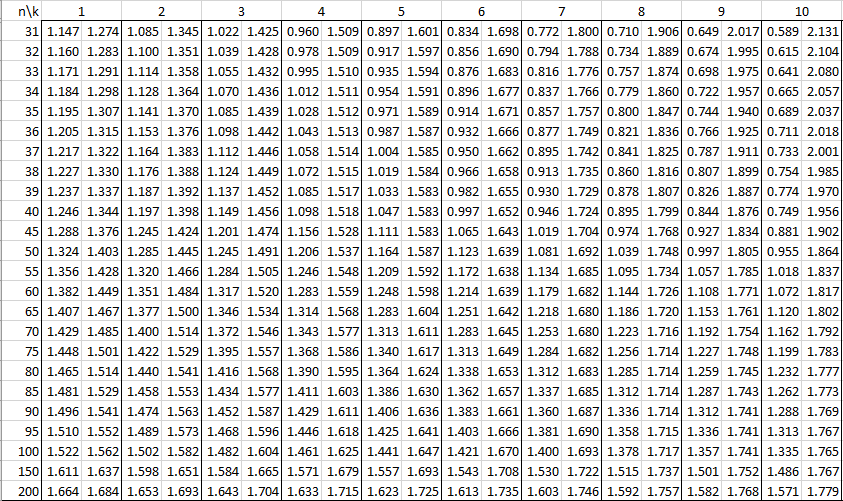
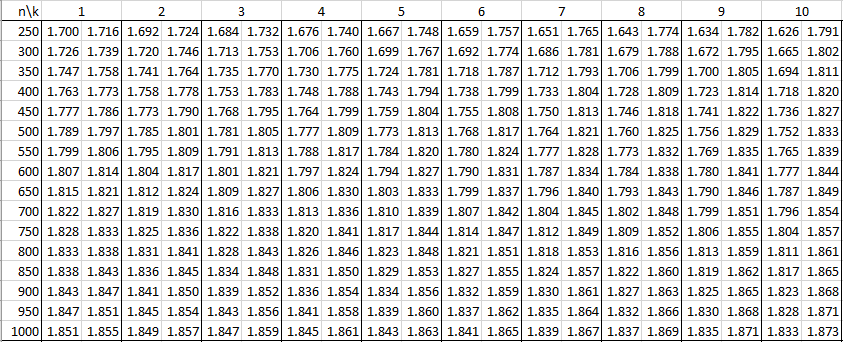
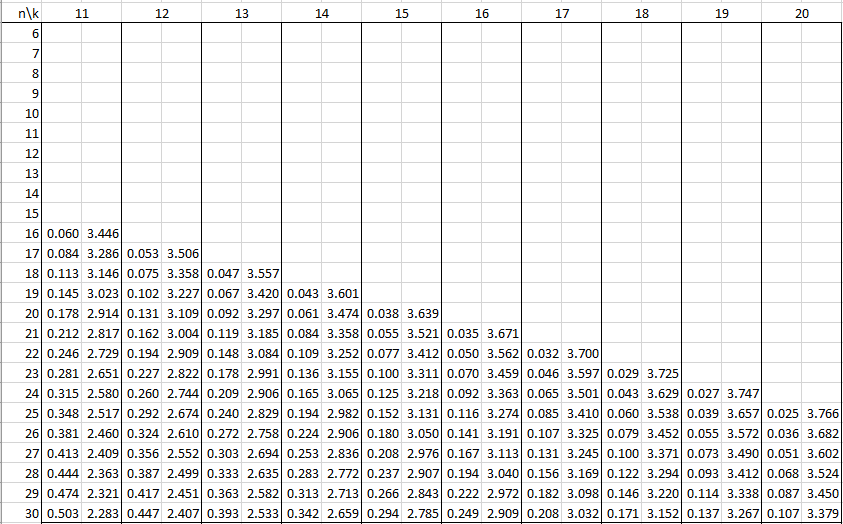
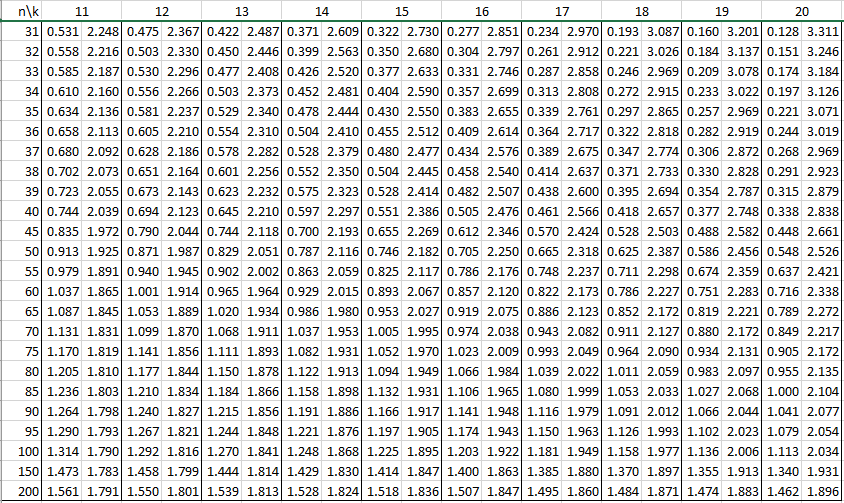
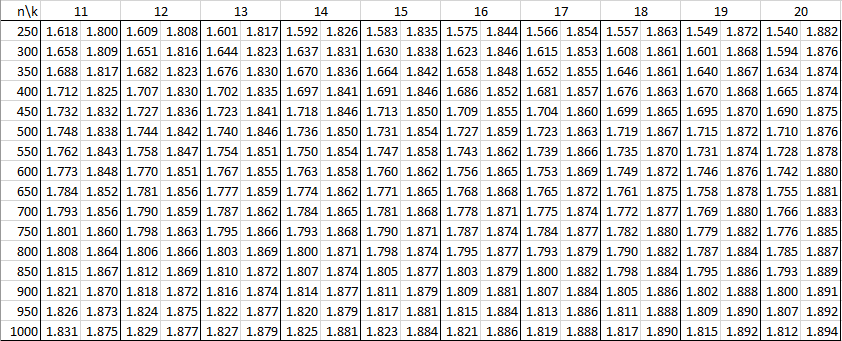
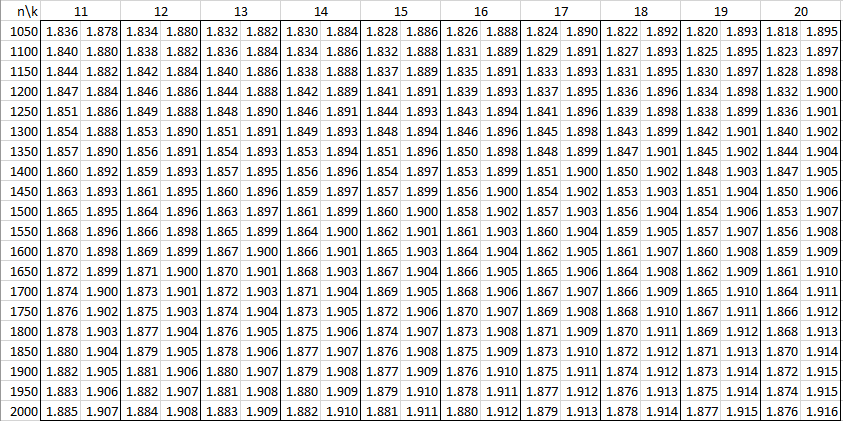
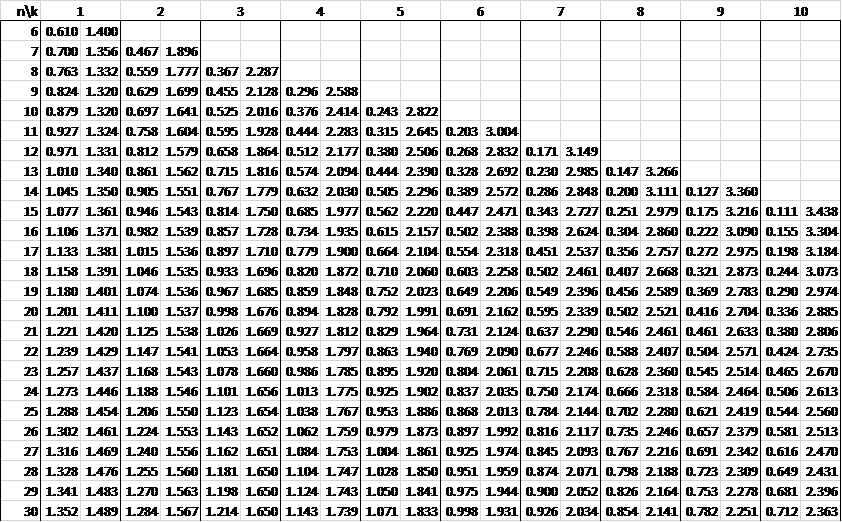
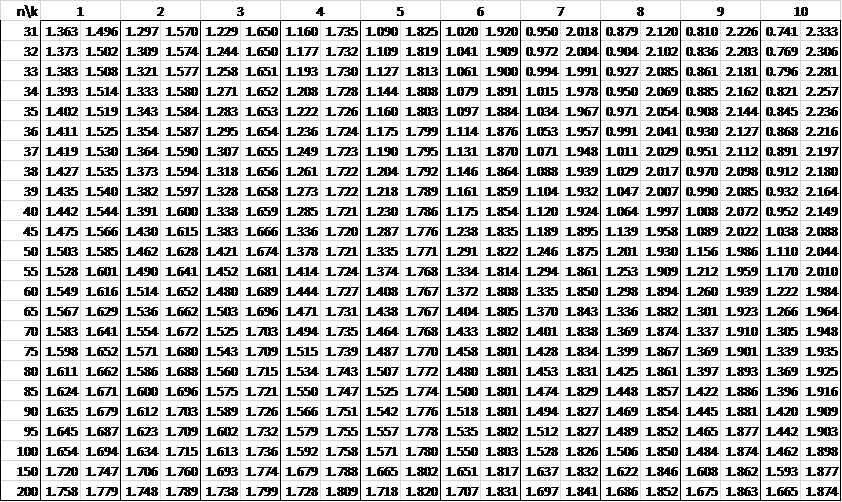
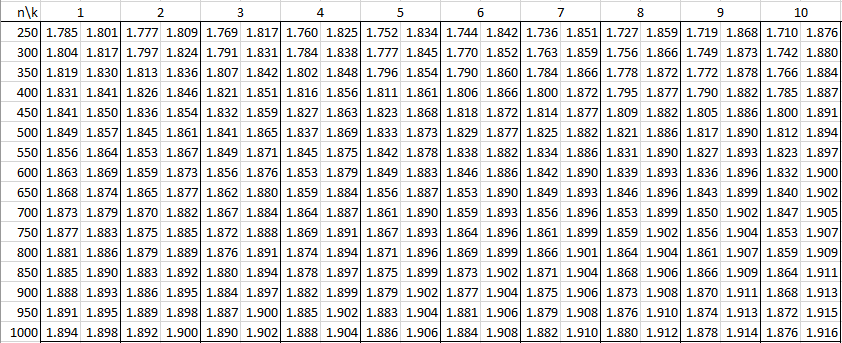
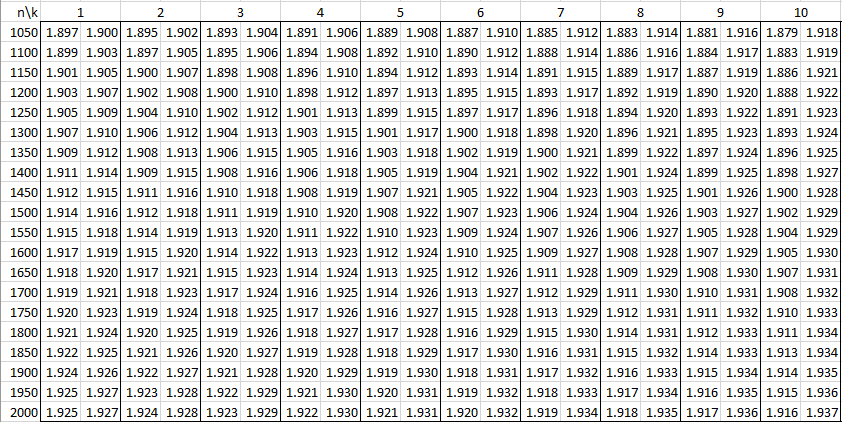
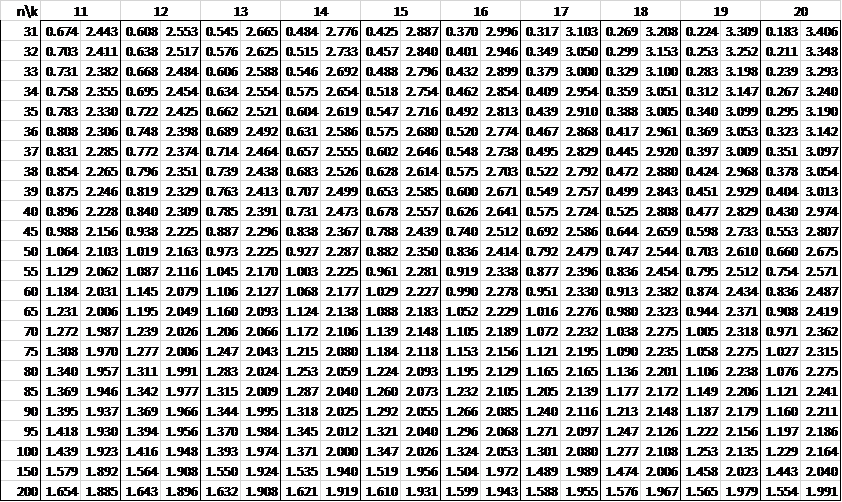
In the following tables, n is the sample size and k is the number of independent variables. See Autocorrelation for details.
Alpha = .01
Alpha = .05
References
Kanji, G. K. (2006) 100 Statistical tests. 3rd Ed. SAGE
https://uk.sagepub.com/en-gb/eur/100-statistical-tests/book229436
Evans, W. N. (2014) Durbin-Watson significance tables
No longer found online


Dear Dr. Charles Zaiontz,
Thank you for all the information you have provided about DW. I am planning to use in my thesis the tables of “no intercept” that are in the reference:
Evans, W. N. (2014) Durbin-Watson significance tables
https://www3.nd.edu/~wevans1/econ30331/Durbin_Watson_tables.pdf
I am afraid I am having some dificulty to confirm the source.
Would you be so kind to clarify it?
Yours sincerely,
Paula
Paula,
Yes, that is the source, although this is not the original source. This may be
https://www.jstor.org/stable/1912825
Charles
Thank you very much. It will look much nicer in the reference list of the thesis. 🙂
Hello, Charles..
If my samples (n=220 and 214), k=4, alpha=0,05.
What is the dU and dL?
Hello Adinda,
You need to interpolate between the 200 and 250 values. See
Interpolation
Charles
help k=3 and n=5236 alpha 0,05
Hello
The table doesn’t support samples larger than n = 2000.
Instead you can use the large sample test described towards the bottom of the following webpage:
https://real-statistics.com/multiple-regression/autocorrelation/durbin-watson-test/
Charles
hi, i want to ask how to find DL and DU for alpha 0.05 if K=3 N=225
Thanks
Hi Zara,
They are about halfway between the values for 200 and 250. You can use the Real Statistics functions to get more exact values.
Charles
Hi! Do you have a step by step procedure on this? I can’t seem to find any instructions about it online
Hi Nica,
See https://real-statistics.com/multiple-regression/autocorrelation/durbin-watson-test/
Charles
Hi, I can’t open file Xrealstat.com, please help
You don’t need to open the Xrealstats.xlam file. You need to install the software as described on the webpage from where you downloaded the file.
Charles
k=2 and n=18 alpha 0,05
As you can see from the table, the lower critical value is 1.046 and the upper critical value is 1.535.
Charles
hello i want to find dL and dU value with alpha=0.1
n=41
k=5
Sorry, but I don’t have table values for alpha = .1, only alpha = .01 and .05.
Charles
Hi. I just found this website and downloaded the Resource Pack to do a Durbin-Watson test with a series of n = 200. I will continue testing and exploring the software. Thank you very much.
Joaquin,
Welcome aboard.
Charles
hi charles, what should i do when the N = 445? should i use the values for 400 or 450?
You can probably use 450, but usually, it is best to interpolate between the values for 400 and 450. See
Interpolation
Charles
Hi! I need help, are there any copies of values with n=1003 and k=4?
thank you and i hope this comment finds you well!
under alpha 0.05 ^__^
Hi Angel,
1003 is so close to 1000 that I would use n = 1000.
Charles
Hi I have a huge dataset with 208248 observations with 12 independent variables. How do I find the DL and DU?
Hi, the table doesn’t cover a sample this large. Instead, you can use the version of the Durbin-Watson test for large samples. This is based on a z-stat that has a standard normal distribution. See the end of the following webpage for details
https://www.real-statistics.com/multiple-regression/autocorrelation/durbin-watson-test/
Charles
Ihave calculated DW 1.7 from regression with 100 observations with k=5,which significance level is appropriate to use?alpha .01 or .05
Generally, alpha is set to .05, but this is the custom. There is no definitive answer.
Charles
Hi,
can u find my DL & DU for
N = 225
K = 4
aplha = 0,05
If you use linear regression, then the values are halfway between the values at N = 200 and N = 250.
Charles
Sorry, I can’t understand what you mean by interpolation. Is seem like calculating the average value? For example, n = 1668 and k = 5, I can use interpolate between the values n = 1650 and n = 1700. Should I calculate the value on average? Or just using 1650 is fine? Thank you
Hello Chris,
If n were 1675, then you could use the average between the values n = 1650 and 1700 (assuming that you use linear interpolation). Since 1668 is slightly below 1675, the average should likely be ok.
In any case, if you get the same result when using n = 1650 as n = 1700, you should be ok just using n = 1650.
For more details about interpolation, see
Interpolation
Charles
What is the alpha, Lower critical value and Upper critical value if my N is = 1258 and K is = 2?
Hello Vani,
You need to interpolate between the n = 1250 and n = 1300 values in the table.
You can also use the Real Statistics DLowerCRIT and DUpperCRIT worksheet functions.
Charles
Hello, Charles
I have n=512, k=3, and alpha=0.05
Could you tell how can I find dL and dU?
Please.
Hello Tiara,
You need to interpolate between the n = 500 and n = 550 values in the table.
You can also use the Real Statistics DLowerCRIT and DUpperCRIT worksheet functions.
Charles
hi, I want to ask how to find for the dL and dU value for alpha = 0.5?
k=11
n=1750
Hi Mira,
If you mean alpha = .05, then you can find this info in the table.
Charles
How I get dL and dU N=1120 & K #9?
You need to interpolate between the table entry for 1100 and 1150. Alternatively, you can use the Real Statistics DLowerCRIT and DUpperCRIT functions.
Charles
If the hypothesis formulated positive relationship & significant and the actual result positive and insignificant, are we rejected or not rejected the hypothesis?
Sorry, but I don’t understand your question.
Charles
To clear my questions, in study there is the formulated hypothesis or the expected sign so, after processing data the actual result differ from the formulated hypothesis.
Examples
H1: There is positive significant relationship between STDTA & ROA
The actual result after processing data
There is positive & insignificant relationship between STDYA & ROA
So, how I reject or I fail to reject H1?
If H1 is the alternative hypothesis, then you don-t reject or fail to reject. You reject or fail to reject it-s complement, namely the null hypothesis.
Charles
Hi! I have 144 observation with alpha = 0.05 and k = 1. What are the dw values?
Ana,
You need to interpolate between 100 and 144. The results will be pretty close to the n = 150.
See Interpolation
Alternatively, you can use the DLowerCRIT and DUpperCRIT Real Statistics functions.
Charles
Thank you sir! (These tables don’t seem very easy to come by.)
Hi Charles,
Please … I want to ask how to find for the dL and dU value for alpha = 0.05 ?
With k=25 and n=120.
tks
RGullo
Roberto,
I don’t have any table entries for k > 20.
Charles
Tks.
Hello Charles,
Please help me with the following query.
What is the dL and dU when n=16 and k=14?
Madhu,
This depends on the alpha value, but in any case, you can look it up in one of the tables on this webpage or use the Real Statistics DLowerCRIT and DUpperCRIT functions.
Charles
Thank you.
But with n = 16 and k = 14, table does not show any value.
Madhu,
I am not sure, but it probably means that the test is inconclusive, i.e. no matter what value you get from the Durbin-Watson test, it is between dL and dU.
Charles
Hello Charles,
If the calculated DW statistic falls between tabulated DL and DU (though very closer to DU), then what is the best practice to be followed? Should I not reject the null hypothesis?
There is no easy answer to your question. You probably have the following choices: (1) assume that you have autocorrelation and take the appropriate remedial action or (2) use a different test to help you determine whether autocorrelation exists.
See the following for more information: https://online.stat.psu.edu/stat501/lesson/14/14.3
Charles
Thank you so much for your prompt reply.
Can you guide me with the name of different tests? Can those be performed in SPSS or STATA?
Madhu,
See https://www.real-statistics.com/multiple-regression/autocorrelation/
I don’t know whether these tests are supported on SPSS or STATA, but probably yes.
Charles
Hello! i need your help my data has 14’579 observations which is out of the table. What am i supposed to do ?
The table handles samples of size up to n = 2000. If your D value is much higher than the upper critical value for n = 2000 or much lower than the lower critical value, then I would use those critical values.
Otherwise, see https://www.tandfonline.com/doi/abs/10.1080/13504851.2019.1691711?journalCode=rael20
Charles
Can advise if my n=252, how should find out the dL and dU?
You just need to interpolate between the results in the table for n = 250 and n = 300. Since 252 is a lot closer to 250 than 300, the values for dL and dU will only be slightly higher than the dL and dU values for n = 250.
Charles
hi, I want to ask how to find for the dL and dU value for alpha = 0.5?
k=3
n=4883
Thanks
I don’t know for sure since it is beyond the table, but it is probably something like dL = 1.934 and dU = 1.938 (my guess-timates). If the test statistic is reasonably far away from these values, then you can probably proceed with the test. If the test statistic is close to these values, then you will need a more precise estimate.
Charles
Hello, if my n is 3000+ data points, is it okay to just use n = 2000? Thank you! Any help is appreciated
Michelle,
It is very likely to be ok. Unless the test statistic is very close to the critical values, it is certainly ok.
Charles
Hello Charles,
I need your help. My data has 306 observations and 17 independent variables. How much are the dU and dL values? I want to know how to count using Excel. Thanks.
For k = 17, the table gives values for n = 300 and n = 350. You need to interpolate between these values to get the value at n = 306 (obviously the DL and DU values are closer to the values at 300 than those at 350). This is explained at
https://www.real-statistics.com/statistics-tables/interpolation/
You can also use the Real Statistics functions DLowerCRIT and DUpperCRIT to return these values, as described at
https://www.real-statistics.com/multiple-regression/autocorrelation/durbin-watson-test/
Charles
Hello, I want to know how to cite these, is there a specific source and author?
There are a number of sources:
https://docplayer.net/28513348-Durbin-watson-significance-tables.html
https://wernermurhadi.files.wordpress.com/2011/07/tabel-durbin-watson.pdf
https://www.statology.org/durbin-watson-table/
Charles
if i have sample 368 and k value 8..so how can i take the DL and DU values ???
what is the meaning of interpolation??
Hello Yasin,
See the following webpage for an explanation of interpolation:
https://real-statistics.com/statistics-tables/interpolation/
Note that 368 is between n = 350 and n = 400. Both of these values are found in the table. Note that DU for either of these values is less than 2.192, and so it is certain that a DW statistic of 2.192 with be greater than DU.
Charles
what is the range of DW results for any research ??
my dw result is 2.192 is it acceptable
See my reply to your other comment.
See my reply to your other comment.
Hi, just wondering whether you have the table for alpha = 0.1 (90%)?
Thanks,
Beatrice
Sorry, but I only have the tables that are shown.
Charles
Excuse me.
i have, k=3, n=7, alpha 0.05
Could you tell how can I find dL and dU? please.
I don’t know since there is no table entry. It probably means that the dL is minus infinity and dU is plus infinity, but I am not certain.
Charles
Thank you
n 935 k 8 alpha 0.05
dL and dU
thanx
You need to interpolate between the table entry for n = 900 and n = 950. See
Interpolation
Charles
Hello, I have value N/K 63 how is mine result for 1, alpha 0,5 thank you
Katarina,
The table only goes up to k = 20. Are you saying that you have 63 independent variables? Alpha is surely not 0,5; perhaps you mean 0,05.
Charles
Hello, i wanna ask you.. i am doing panel data regression with 9 cross section and 11 independent, with 207 observation period. Do i have n=9 or n=207 ?
for both the value, i cannot find the Du and Dl. can you help me out ? Thanks
Hello Abid,
I haven’t added support for panel data yet.
Charles
Hi,
My name is Nathalie, I have a question. Why the durbin watson tables for alpha=0,01 are the same than tables for alpha=0,05 (K=1 and n<=200)?
Thank you for your answer
Best regards
Nathalie,
It looks like copied the wrong table values.
Thanks for catching this mistake. I will correct it today.
Charles
Excuse me.
i have, k=7, n=9, alpha 0.05
Could you tell how can I find dL and dU? please.
Since there is no table entry, I believe this is equivalent to dL = 0 and dU = 4.
Charles
Morning mr charles, My name is Jiwon.
May i know what if my sample size over 20,000?
I can not see any critical value for the very large sample..
I run the multiple regression with n=29862, k=16, D=1.18
Thank your for your comments..
Hello Jiwon,
I don-t have a table for n > 20,000, but you can see from the existing table that the critical values are close to 2. Since D = 1.18, it is clear that D < DL. Charles
Hello, Charles..
If my samples (n=304), k=5, alpha=0,05, what is the dU and dL?
If my samples n=304, k=4, alpha=0,05
what is the dU and dL?
Thank u
Joseph,
You can interpolate between the values n = 300 and n = 350. The values should be close to the n = 300 values.
You can also use the Real Statistics DLowerCRIT and DUpperCRIT functions.
Charles
Hi, Charles
Thank u for your information. But, i never interpolate and never using real statistics. How?
Thanks Charles
Joseph,
See Interpolation
Charles
i have, k=3, n=315, alpha 0.05
how can I find dL and dU?
Hi Gabriella,
The table shows dL = 1.791 and dU = 1.831 for n = 300 and dL = 1.807 and dU = 1.842 for n = 350. You need to use interpolation between these values to get the dL and dU values at n = 315. Alternatively, you can use the Real Statistics function DLowerCRIT and DUpperCRIT functions. See the following webpage for information about interpolation
Interpolation
Charles
Hi, my name is Débora I have a question.
For example My test the Durbin Watson is 2,896. How I now or how I see in the table what is p value (alpha 0,05)
Hi Debora,
The table gives the critical values, not p-values.
Charles
hi, I want to ask how to find for the dL and dU value for alpha = 0.1?
k=5
n=72
alpha=0.1 (90% level of confidence)
thanks
The table contains the values for 70 and 75, and so you need to interpolate (dL and dU) between these values. See the following webpage for how to interpolate:
Interpolation
Alternatively, you can use the Real Statistics DLowerCRIT and DUpperCRIT functions.
Charles