Example
Real Statistics Data Analysis Tool: You can use Real Statistics’ Item Analysis data analysis tool for item analysis, as described in the following example.
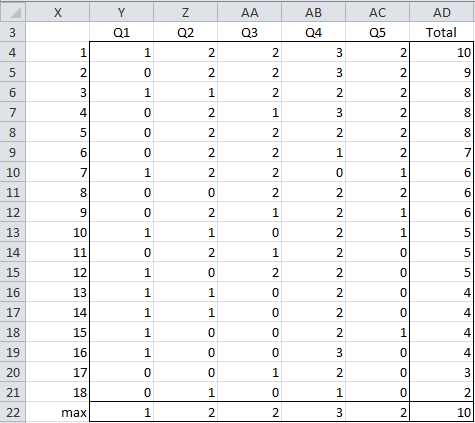
Example 1: Repeat Example 1 from Partial Score for Item Analysis using the Item Analysis data analysis tool (the data is reproduced in Figure 1 below).
Figure 2 – Data for Example 1
Dialog Box
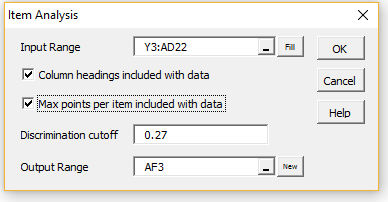
Press Ctrl-m and select the Item Analysis option from the Corr tab. If using the original user interface, after pressing Ctrl-m, select the Reliability option and then select the Item Analysis option from the dialog box that appears. In either case, fill in the dialog box that appears as shown in Figure 1.
Figure 2 – Item Analysis data analysis tool dialog box
Note that we have specified that the first row of the Input Range consists of column headings and the last row contains the maximum score for each question (if this option is not checked then it is assumed that each item is worth 1 point). The discrimination cutoff is set to the default value of .27.
Output
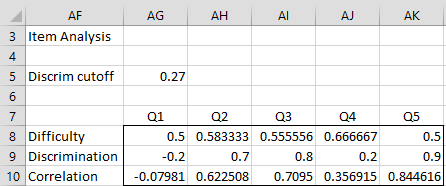
The output is shown in Figure 3.
Figure 3 – Item Analysis output
Examples Workbook
Click here to download the Excel workbook with the examples described on this webpage.
References
Matlock-Hetzel, S. (1997) Basic concepts in item and test analysis. Texas A&M
http://ericae.net/ft/tamu/Espy.htm
Office of Educational Assessment (2016) Understanding item analysis. University of Washington
http://www.washington.edu/assessment/scanning-scoring/scoring/reports/item-analysis/
Zimmaro, D. M. (2016) Writing good multiple choice exams
https://ctl.utexas.edu/sites/default/files/writing-good-multiple-choice-exams-fic-120116.pdf
Vallejo-Elias, J.(2016) Interpretation of discrimination data from multiple-choice test items
No longer available online
Albano, A. (2016) Introduction to educational and psychological measurement, Course Notes. University of Nebraska-Lincoln
https://digitalcommons.unl.edu/cgi/viewcontent.cgi?article=1005&context=prtunl


Hi,
is it possible to conduct item analysis with exam data of multiple choice and the key and especially distractor analysis with your tool.
The tool can be used for multiple-choice tests. You can perform distractor analysis as described on the website, although the tool doesn’t support this.
Charles
Dear Charles,
Thank you for your incredible work.
I have used the item analysis tools for a research project and I would like to cite the must-read articles on the topic of discrimination and difficulty coefficient, and partial score. Do you have them somewhere on your website ? I can’t seem to find them.
best regards,
Louis
Dear Louis,
If you are trying to cite the Real Statistics website, see
Citation
Charles
Hi. Thanks a lot for the real stat item analysis. I have one question, how do we determine the discriminant cut of value?
This is a user-defined value. The recommended value is .27.
Charles
Dear Mr. Charles,
I cannot find the reliability data analysis tool in the menu that shows after i pressed CTRL + M. I can only see the following tabs in the menu that appears: Desc; Reg; Anova; Time S; Mutivar; Corr; Misc.
Hope you can help me with this.
Kim,
If you click on the Corr tab, you will find the various reliability data analysis tools.
Charles
Hi Charles:
Two questions:
1) In the example provided above, you have continuous variables and nominal variables; however, the correlation stat output uses Pearson rho for all comparisons? Is this one method robust across variable types?
2) Would you please explain how the discriminant cutoff works?
Thank you
Yousaf,
1. Pearson’s rho is used for all types of variables. All the variables are at least ordered and are treated as if they were continuous.
2. The typical cutoff is 27%. I.e. the bottom group consists of the those whose total score is in the lowest 27th percentile and whose top group is in the highest 27th percentile. The only issue is what to do if the the total scores bleed over the boundaries. E.g. if there are 100 students, then ideally the bottom group and top group should have 27 students each. If the score of the student 27th highest grade is different from the one with the 28th highest grade, then there is no problem (and similarly for the lowest grades). If this is not the case, then there are a few options: (1) expand the top group to include all the students with the same grade as the student with the 27th highest grade or (2) keep the sizes of the groups at 27, but perform some sort of interpolation as to the scores on the single question across all the students with the same grade as the student with the 27th highest grade, (3) randomly assign students to the top group when there are ties (i.e. where the total score is the same as the 27th highest score), etc. (I am sure there are other approaches that I haven’t thought of yet). The Real Statistics software uses option (2).
Charles
Hi Charles: thanks a million for your reply. Would be able to expand a little further on the phrase, “some sort of interpolation?”
Thanks
Yousuf
Yousuf,
There are a number of alternative ways of performing this interpolation. The approach used by Real Statistics is described on the following webpage:
https://real-statistics.com/reliability/item-analysis/calculations-item-analysis/
Sometime in the future I will describe other possible approaches.
Charles
Sir Charles, do you have an excel template for item analysis? with sample data and interpretation whether to revise or remove an item? Thank you and God Bless.
Maria,
You can use the output from the Item Analysis data analysis tool as a template.
Regarding whether to revise or remove an item, see the webpage Item Analysis
Charles
Hi!
Thanks for all. How I said I will cite this add-in in my work.
One question:
In this ” Item Analysis” in Difficulty, Disc… and Correlation, what formulas/method you use in each one of them?
Thanks
Jose
Jose,
You can cite the add-in as described on the webpage
https://real-statistics.com/appendix/citation-real-statistics-software-website/
The formulas are described on the webpage
https://real-statistics.com/reliability/item-analysis/item-analysis-basic-concepts/
Charles