On this webpage, we provide additional information about how to create a Bland-Alman Plot using Excel charting capabilities.
Example
Note that the x values for the scatter plot in Figure 2 of Bland-Altman Plot range from 30 to 80, and so we specify in range V2:Y3 of Figure 1 (which is a repeat of Figure 4 of Bland-Altman Plot) the endpoints for the three horizontal lines (for the mean and lower and upper limits) shown in Figure 2.
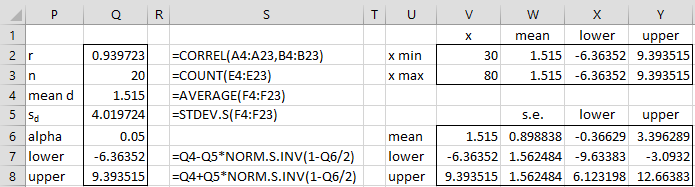
Figure 1 – Calculation of Mean and Limits of Agreement
We add these horizontal lines to the scatter diagram by adding three series to the scatter diagram data.
Adding the horizontal lines
To do this, click on the scatter diagram and then select Design > Data|Select Data. This brings up a dialog box as shown in Figure 2.
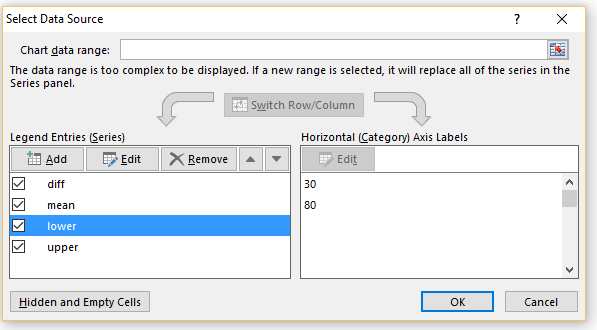
Figure 2 – Adding the Horizontal Lines
Initially, only the first series was present. We have added three series corresponding to the three horizontal lines. We now show how to add the lower limit series (the procedure to add the mean and upper limit series is similar).
Click on the Add button on the left-hand side of the dialog box in Figure 3. Fill in the values indicated (referring to the cells in Figure 1) on the dialog box that appears as shown in Figure 3, and click on the OK button.
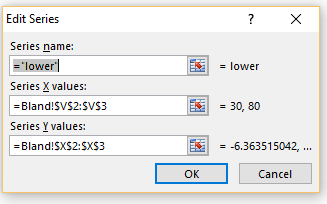
Figure 3 – Adding the Lower Limit series
Filling in the horizontal lines
Actually, this won’t add the horizontal line, but only the two endpoints of this line. To add the line, we need to right-click on either of these endpoints (on the chart shown in Figure 1 of Bland-Altman Plot) and then choose the Change Series Chart Type … option from the menu that appears. This brings up the dialog box shown in Figure 4.
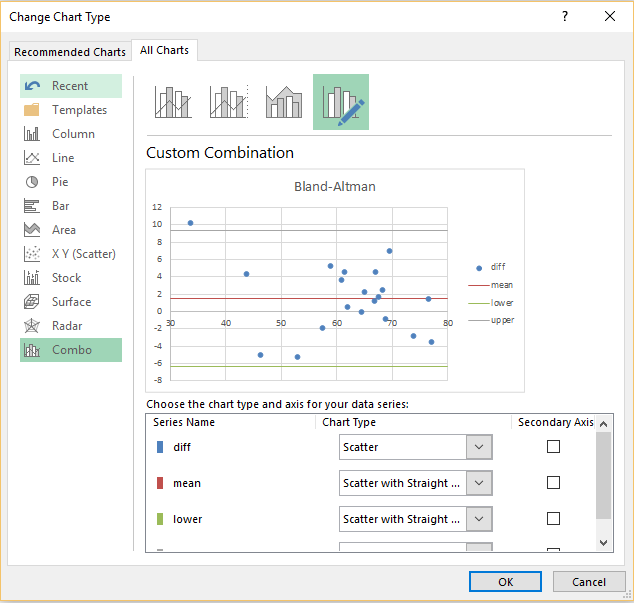
Figure 4 – Change Chart Type dialog box
Now click on the downward-pointing arrow next to the “lower” series and change the Chart Type from Scatter to Scatter with Straight Line, and then click on the OK button.
Examples Workbook
Click here to download the Excel workbook with the examples described on this webpage.
Links
Reference
Giavarina, D. (2015) Understanding Bland-Altman. Biochemia Medica
https://www.ncbi.nlm.nih.gov/pmc/articles/PMC4470095/
Bansel, S. (2019) How to create combination charts in Excel – step-by-step tutorial.
https://trumpexcel.com/combination-charts-in-excel/
Dear Charles,
I would like to add to my previous message that I have found the following tutorial, https://analyse-it.com/docs/tutorials/bland-altman/estimating-loa-percentile. However, I do not have the add-in for excel “analyse-it ribbon tab” and I am neither a programmer, but I have access to SPSS. Thus, I am searching for other easy means of calculating the 2.5th and 97.5th percentiles.
Thank you.
You should be able to use the Real Statistics tool. See
https://www.real-statistics.com/reliability/interrater-reliability/bland-altman-analysis/real-statistics-support-bland-altman/
Charles
Dear Charles,
Thank you so much for this explanation. I am currently using the non-parametric Blandt and Altman method, because of violation of normal data distribution of the differences. Therefore, the average bias is estimated as the median of the differences. But, how should I best calculate the 2.5th and 97.5th percentiles score i.e. limits of agreement for a non-parametric Blandt and Altman?
I have currently calculated the percentiles for each difference according to the following instructions . But it does not provide the means to calculate the values for the 2.5th and 97.5th percentiles. http://advisor.morningstar.com/Enterprise/VTC/Morningstar_Ranks_Absolute_Percentile_Fractional.pdf. Is that an appropriate method for any percentile? If so, what is the best way to estimate the value for the 2.5th and 97.5th percentile? Is there any tutorial available on this topic?
Thank you for your advice.
Hello,
I think what you are looking for is described at
https://www.real-statistics.com/reliability/interrater-reliability/bland-altman-analysis/confidence-interval-bland-altman/
Charles
how it is possible to make TEa% in bland-Altman plot?
What is a TEa% ?
Charles
total allowable error (TEa).”Bias can be compared against a systematic error%, and imprecision against a random error%, of a total allowable error goal. The total allowable error can be specified in absolute units of the analyte, as a percentage of analyte concentration, or as a combination of the two in which case the larger of the absolute and percentage concentration is used.” tooken from analyse-it.com
Maryam,
I don’t know the answer to your question.
Charles