On this webpage, we describe in detail the Outliers and Missing Data option of the Real Statistics Descriptive Statistics and Normality data analysis tool. We use the example data shown in Figure 3 of the Descriptive Statistics and Normality Tool, repeated in Figure 1 below.
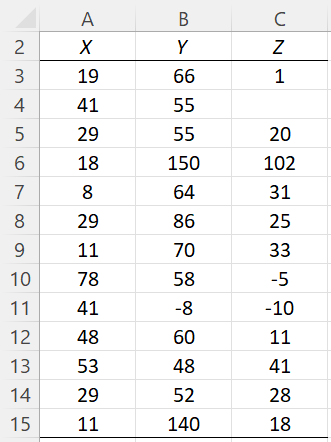
Figure 1 – Example data
Outliers and Missing Data
The Outliers and Missing Data option identifies potential outliers and missing data. Whether an element in a data set is flagged as an outlier is determined by the Outlier Limit field shown in Figure 2 of Descriptive Statistics and Normality Tool. The default for this field is 2.5, but you can change it to any value between 1.0 and 6.0.
An element in any of the columns in the Input Range is considered to be an outlier when the standardization of that element based on the mean and standard deviation for that column is greater than the value in the Outlier Limit field.
The output from this option is shown in Figure 2.
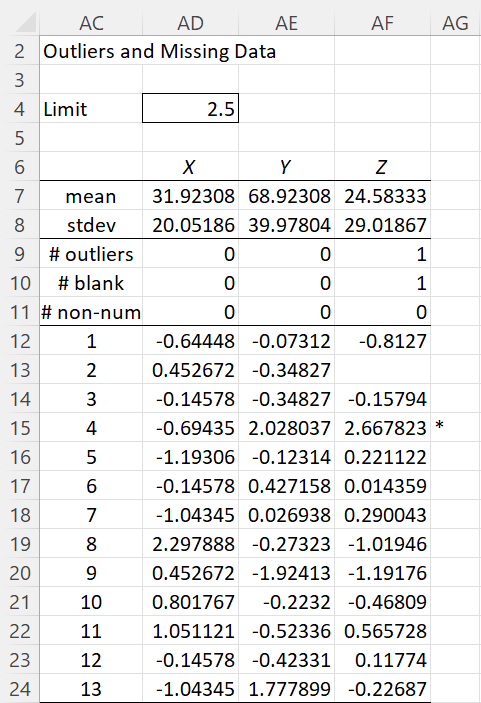
Figure 2 – Outliers and Missing Data output
Observations
We see from rows 7 and 8 of Figure 2 that there is only one missing data element, namely a blank element in data set Z, which we can see is element #2; this corresponds to cell C4 from Figure 1. There are no missing elements that are non-numeric. If we insert the text “x” in cell C4 of Figure 1, then the value in cell AF13 would change to “ ******* “.
The values in range AD12:AF23 of Figure 2 are the z-scores of the elements in the three data sets. E.g. The value of the first element in data set X is 19, as shown in cell A3 of Figure 1. The z-score for this element is -.64448, as shown in cell AD12 of Figure 2. This value is calculated by =STANDARDIZE(A3, AD7, AD8).
We also see from row 9 of Figure 2 that only data set Z contains an outlier. The asterisk in cell AG15 shows that this outlier is element #4, which corresponds to cell C6 from Figure 1. That this is an outlier is also evident from the fact that it is the only cell in range AD12:AF23 whose value is greater than or equal to 2.5 or less than or equal to -2.5. Here 2.5 is the value specified for the Outlier Limit field in Figure 2 of Descriptive Statistics and Normality Tool and repeated in cell AD4 of Figure 2.
Details
Representative formulas from Figure 2 are shown in Figure 3.
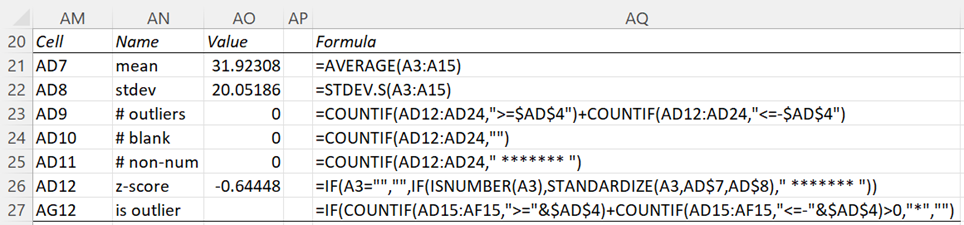
Figure 3 – Outliers and Missing Data details
If you change any of the values in Figure 1 (including changing a numeric value to a non-numeric value or vice versa), the values output in Figure 2 will change accordingly. You can also change the Outlier Limit value in cell AD4 and whether an asterisk appears in column AG will change accordingly.
If you add additional elements to the data sets in Figure 1, these will not be considered.
See Identifying Outliers and Missing Data for more information about this data analysis tool.
Hello Mr. Zaiontz,
many thanks for your excellent Excel toolbox. It is convenient to use and helps me alot in my everyday work. However, what is your opinion on adding the Hampel test as an additional tool for finding outliers to the toolbox?
Best regards,
J.-H. Richard.
Thank for the suggestion.
I will add this to the next release of the Real Statistics software.
Charles