Basic Concepts
In Two-Period Demeaning, we showed how to apply demeaning for panel data with only two time periods. Demeaning can also be applied when there are more than two time periods.
Example
Example 1: Repeat Example 1 of Differencing for Panel Data using demeaning.
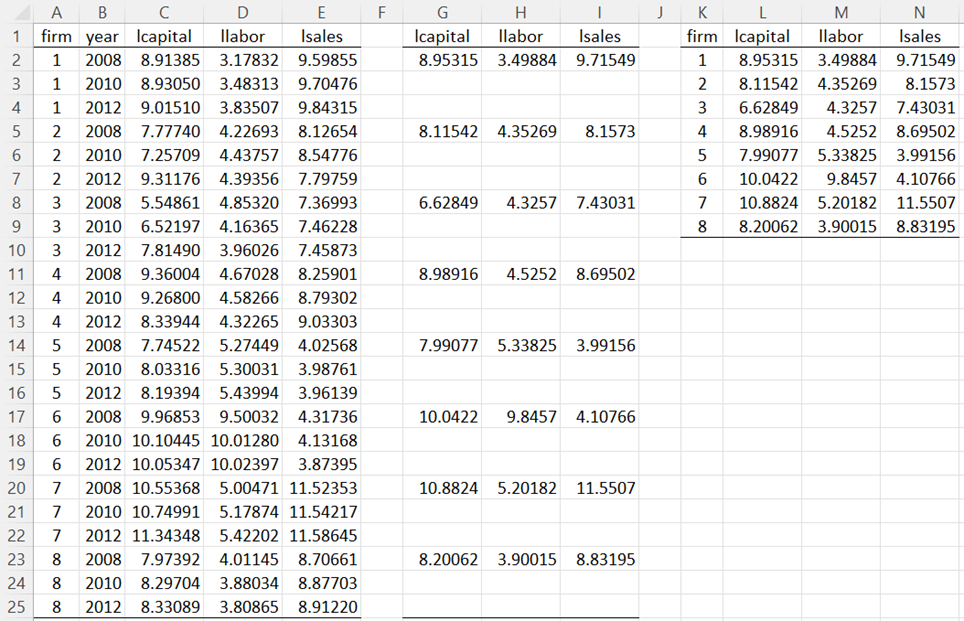
We first need to calculate the means of the data for each company, as shown in Figure 1.
Figure 1 – Unit means
One approach is like that used for differencing. Place the formula =IF($B2=2008,AVERAGE(C2:C4),””) in cell G2, highlight range G2:I25, and press Ctrl-R and Ctrl-D. Next, we place the array formula =DELROWS(G1:I25,TRUE) in range K1:N9.
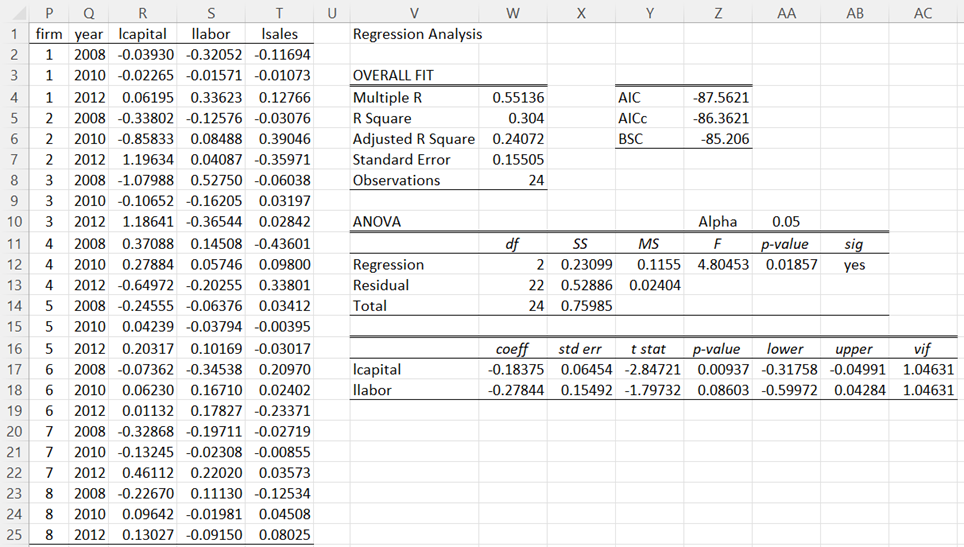
We now subtract these unit means from the data in Figure 1, as shown in Figure 2. Here we place the formula =C2-INDEX(L$2:L$9,$P2,1) in cell R2, highlight range R2:T25, and press Ctrl-R and Ctrl-D. We can then use OLS regression without an intercept to obtain the results shown on the right side of Figure 2.
Figure 2 – Regression of demeaned data (initial estimates)
Correcting Standard Errors
It turns out that the standard errors shown in Figure 2 are wrong and need to be corrected. This is done by reducing the number of Observations (cell W8) by the number of units (8 for Example 1). We then need to adjust the standard errors for each of the coefficients by multiplying the standard error in Figure 2 by the factor
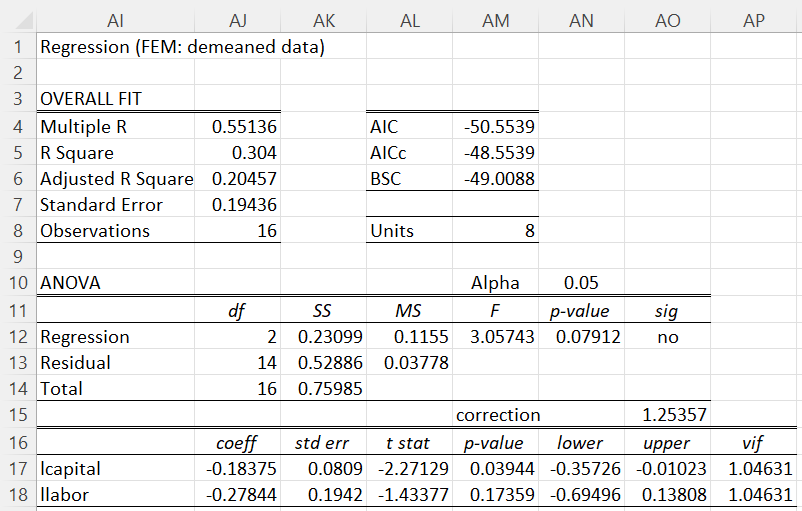
The result is shown in Figure 3.
Figure 3 – Corrected regression
Here the unit count in cell AM8 has been added and the Observations in cell AJ8 now contains the formula =COUNT(AG2:AG25)-AM8. Furthermore, the correction factor in cell AO15 is calculated using the formula =SQRT(1+AM8/AJ13), and the standard errors in cells AK17 and AK18 are calculated by the formulas =X17*AO15 and =X18*AO15, respectively.
Once again, we see that the lcapital variable is significant, while the llabor variable is not.
Worksheet Functions
Real Statistics Functions: The Real Statistics Resource Pack provides the following worksheet functions where R1 contains balanced panel data sorted first by unit and then by time period with the data for the dependent variable in the last column (as in columns C, D, and E of Figure 1).
PANEL_MEANS(R1, periods, head): returns an array with the unit means for the data in R1 based on periods number of time periods.
PANEL_DEMEAN(R1, periods, head, weight): returns an array in which each data element in R1 is replaced by that data element minus weight times its corresponding unit mean value where there are periods number of rows of data for each unit. weight takes values between 0 and 1 and defaults to 1.
if head = TRUE (default FALSE) then it is assumed that the panel data contains column headings and that these will be used to create column headings for the output.
Thus, we can obtain the values in range L1:N9 via the array formula =PANEL_MEANS(C1:E25,3,TRUE) and the values in range R1:T25 via the array formula =PANEL_DEMEAN(C1:E25,3,TRUE).
Using a weight value less than 1 will turn out to be useful for random-effects models, as described in Random-effects Model.
Examples Workbook
Click here to download the Excel workbook with the examples described on this webpage.
References
Gujarati, D. & Porter, D. (2009) Basic econometrics. 5th Ed. McGraw Hill
http://www.uop.edu.pk/ocontents/gujarati_book.pdf
Hill, R. C., Griffiths, W. E., Lim, G. C. (2018) The principles of econometrics. 5th edition. Wiley.


