Basic Concepts
In the non-comprehensive models at least one of the variables is not used. We show how to calculate the expected frequencies for one such model, namely (A, B). The degrees of freedom are abc – (a – 1) – (b – 1) –1 = abc – a – b + 1.
Example
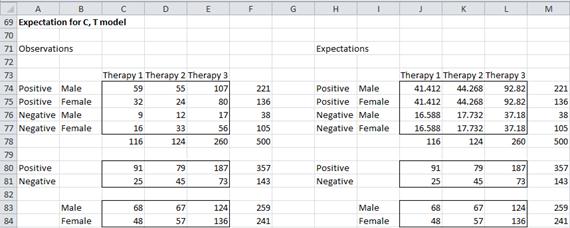
Figure 1 displays the expected frequencies for this model for the data in Example 1 of Three-way Contingency Tables.
Figure 1 – Expected frequencies for (C, T) model
For example, the expected frequency of a positive result for males taking therapy 1 (cell J74) is calculated via the formula =M80*J78/(COUNTA(I83:I84)*M78). The degrees of freedom for this model is 2 ∙ 2 ∙ 3 – 2 – 3 + 1 = 8. χ2 (maximum likelihood) is 65.13 with 8 degrees of freedom, which is significant, and so this model is not a good fit for the data.
Examples Workbook
Click here to download the Excel workbook with the examples described on this webpage.
Reference
Howell, D. C. (2010) Statistical methods for psychology (7th ed.). Wadsworth, Cengage Learning.
https://labs.la.utexas.edu/gilden/files/2016/05/Statistics-Text.pdf
