Objective
In Two-way Repeated Measures Anova, we show how to perform two within-subjects factors repeated measures analysis using ANOVA techniques. We now show how to accomplish this objective using multivariate techniques, specifically Hotelling’s T-square testing.
A and B have two levels
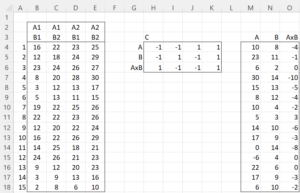
Example 1: Two treatments (A1 and A2) have been developed to improve reflexes. Both treatments have been given to 15 women with care taken to avoid confounding effects. For each treatment, we measure the improvement for the left leg (B1) and improvement for the right leg (B2) with the data shown on the left side of Figure 4.
Transformations
We have three factors: A, B, and the interaction A×B. For the repeated measures data of factor A, for each row in range B4:E18, we add the corresponding values for A2 and subtract the values for A1. We see this in the first row of matrix C. Note that we obtain the difference data for factor A, as shown in range M4:M18, by using the array formula =MMULT(B4:E18, TRANSPOSE(H4:K4)).
For the repeated measures data of factor B, for each row in range B4:E18, we add the corresponding values for B2 and subtract the values for B1. We see this in the second row of C. As usual, we obtain the difference data for factor B, shown in range N4:N18, by using the array formula =MMULT(B4:E18, TRANSPOSE(H5:K5)).
Finally, we obtain the repeated measures data of A×B by adding the A1×B1 and A2×B2 data and subtracting the A1×B2 and A2×B1 data. This is captured in the third row of C, which can be obtained by multiplying the corresponding A and B rows; i.e. by inserting =H4*H5 in cell H6, highlighting range H6:K6, and pressing Ctrl-R. As before, we obtain the difference data for A×B, via the array formula =MMULT(B4:E18, TRANSPOSE(H6:K6)), as shown in range O4:O18.
Actually, we can obtain the difference data for all three factors, as shown in range M4:O18, via the array formula =MMULT(B4:E18, TRANSPOSE(H4:K6)).
Figure 1 – Differences for two within-subjects repeated measures analysis
Analysis
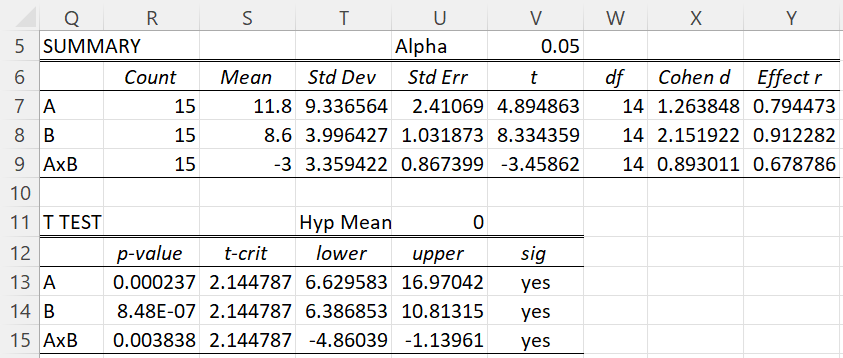
We can now perform three separate one-sample t-tests to obtain the results shown in Figure 2.
Figure 2 – Two within-subjects repeated measures analysis
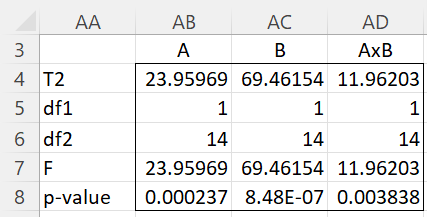
The figure is obtained by merging the three one-sample t-test results. We can obtain similar results by inserting the array formula =Hotelling(M4:M18,,0, TRUE) in range AA4:AB8 and the array formulas =Hotelling(N4:N18,,0) and =Hotelling(O4:O18,,0) in ranges AC4:AC8 and AD4:AD8, respectively, as shown in Figure 3.
Figure 3 – Hotelling analysis for two within-subjects repeated measures
A has two levels and B has three levels
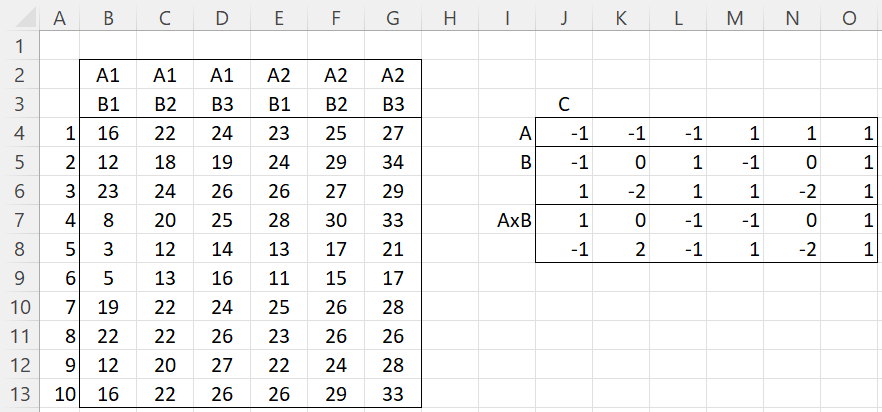
Example 2: Perform repeated measures analysis for the data on the left side of Figure 4 based on two treatments, A1 and A2, measured over three time periods B1, B2, and B3.
Figure 4 – 2 × 3 within-subjects repeated measures data
Transformations
To obtain the repeated measures version of the data, we use the matrix C shown on the right side of the figure. Since A only contains two levels, the first row of C is similar to the first row of C in Figure 1. Since factor B has 3 levels, we need two transformation rows in C (one fewer than the number of levels).
There are a number of choices for the values to assign to these rows. The important thing is that the sum of the values in each row for A or B is zero, and for any pair of these rows the product of the corresponding entries sum to zero. In Example 2 we show one way to assign the values in the transformation matrix C.
To obtain the transformation rows for A×B, we need to multiply the A transformation values by the B transformation values, element by element. We do this by inserting the formula J$4*J5 in cell J7, highlighting range J7:O8, and then pressing Ctrl-R and Ctrl-D.
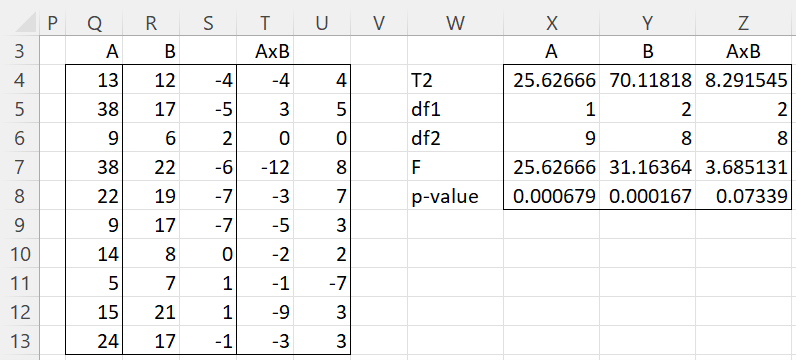
The transformation for all three factors is obtained via the array formula =MMULT(B4:G13, TRANSPOSE(J4:O8)) as shown on the left side of Figure 5.
Figure 5 – Two-way repeated measures analysis
Analysis
We then obtain the analyses for each of the three factors as shown on the right side of the figure by inserting the array formula =Hotelling(Q4:Q13,,0, TRUE) in W4:X8, and the array formulas =Hotelling(R4:S13,,0) and =Hotelling(T4:U13,,0) in ranges Y4:Y8 and Z4:Z8, respectively.
Data Analysis Tool
Click here for a description of Real Statistics’ data analysis tool for two within-subjects factors repeated measures using multivariate techniques. An example is provided where factors A and B each have 3 levels. Also describes a Real Statistics worksheet function that creates the transformation matrix.
Examples Workbook
Click here to download the Excel workbook with the examples described on this webpage.
Reference
Rencher, A.C. (2002) Methods of multivariate analysis (2nd Ed). Wiley-Interscience, New York.
http://math.bme.hu/~csicsman/oktatas/statprog/gyak/SAS/eng/Statistics%20eBook%20-%20Methods%20of%20Multivariate%20Analysis%20-%202nd%20Ed%20Wiley%202002%20-%20(By%20Laxxuss).pdf
