Objective
The Real Statistics Resource Pack provides a number of worksheet functions to support PLS regression in Excel. We describe these functions and show how they can be used to obtain some of the results based on Example 1 of PLS Regression Example.
Once again, we use the data in Figure 1.
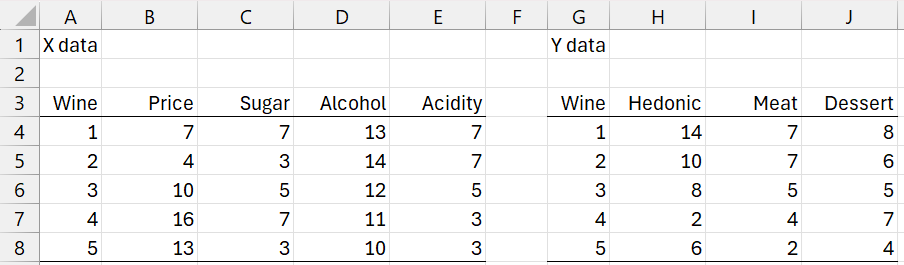
Figure 1 – Wine Data
Creating a PLS regression coefficient matrix
PLSRegCoeff(Rx, Ry, h, head, unstd, iter, prec); returns the PLS regression coefficient matrix based on the X data in Rx, Y data in Ry, and h latent vectors.
If head = TRUE (default FALSE), then the first row of Rx and Ry contain column headings. The output will use these column headings. If unstd (default TRUE) then the unstandardized regression coefficients are returned; otherwise the standardized coefficients are returned.
iter = the maximum number of inner loop iterations (default 100). If in any inner iteration, the difference between all the entries in the t vector change by less than or equal to prec (default .0000001), then the iteration is terminated. If h is omitted it defaults to min(k, n) where k = the number of rows in Rx and n = the number of columns in Rx.
Two examples of the use of this function are shown in Figure 2.
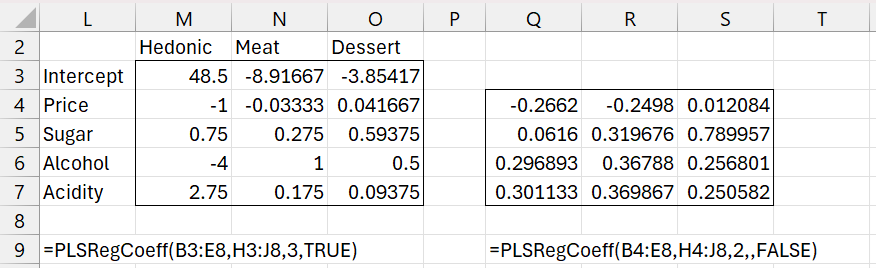
Figure 2 – PLSRegCoeff Examples
Note that the result on the left in range L2:O7 matches the result shown in T131:W136 of Figure 12 in PLS Regression Example. The result on the right in range Q4:S7 matches the result shown in P139:R142 of Figure 10 in PLS Regression Example.
Percentage Variance Explained
PLSRegVar(Rx, Ry, h, iter, prec): returns an array with the X and Y variances attributed to each of the h latent vectors.
The arguments in this function are as for PLSRegCoeff and assume that Rx and Ry don’t contain column headings.
Figure 1 of PLS Regression: How Many Latent Vectors? displays a summary of the percentage variance explained by each additional group of latent vectors. We obtain a similar result by using the array formula =PLSRegVar(B4:E8,H4:J8,3), as shown in Figure 2 (with a bit of reformatting).
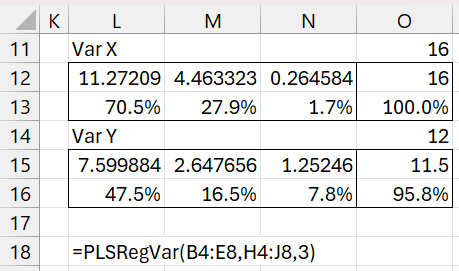
Figure 2 – PLSRegVar output
Cross Validation
PLSRegPRESS(Rx, Ry, h, iter, prec): returns the PRESS value based on the actual Y values in Ry compared to the predicted Y values corresponding to the X values in Rx based on the PLS regression derived from the X and Y data in Rx and Ry using h latent vectors.
The arguments in this function are as for PLSRegCoeff and assume that Rx and Ry don’t contain column headings.
We obtain the results shown in Figure 4 of PLS Regression: How Many Latent Vectors? by entering the formula =PLSRegPRESS(B$4:E$8,H$4:J$8,J183) in cell K183, highlighting range K183:K185, and pressing Ctrl-D.
Predictions
You can also use the multivariate regression prediction formula MRegPredC to make predictions. For example, Figure 4 shows how to duplicate the predicted Y values for Example 1 of PLS Regression Residuals and Predictions based on PLS regression with 3 latent vectors.
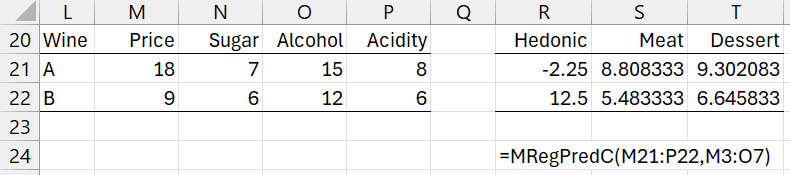
Figure 4 – MRegPredC output
The regression coefficients come from range M3:O7 in Figure 2. Note that you can obtain the same result by using the formula =MMULT(DESIGN(M21:P22),M3:O7).
Bootstrapping
Click here for information about the use of bootstrapping with PLS regression.
Examples Workbook
Click here to download the Excel workbook with the examples described on this webpage.
References
Hervé Abdi (2003) Partial least squares (PLS) regression
https://www.utdallas.edu/~herve/Abdi-PLS-pretty.pdf
Ng, K. S. (2013) A simple explanation of partial least squares
https://users.cecs.anu.edu.au/~kee/pls.pdf
Del Zotto, S. (2013) The PLS regression model: algorithms and application to chemometric data
https://air.uniud.it/bitstream/11390/1132276/1/10990_248_PhDthesisDelZotto.pdf
Wise, B. M. (2019) Properties of partial least squares (PLS) regression, and differences between algorithms
https://eigenvector.com/Docs/Wise_pls_properties.pdf
Minitab (2025) Methods and formulas for model information in partial least squares regression
https://support.minitab.com/en-us/minitab/help-and-how-to/statistical-modeling/regression/how-to/partial-least-squares/methods-and-formulas/model-information/
Kavsek, B. (2002) Partial least squares (PLS) regression and its robustification
https://repositum.tuwien.at/bitstream/20.500.12708/13536/2/Kavsek%20Barbara%20-%202002%20-%20Partial%20least%20squares%20PLS%20regression%20and%20its…pdf