Objective
We describe how to calculate the residuals from a PLS regression model and how to use the PLS regression coefficients to predict the Y-values based on X data, including data that was not in the original training set. We illustrate these concepts using the example in PLS Regression Example. In particular, we make reference to the PLS regression coefficients in Figure 12 on that webpage (and especially range U132:W136 in that figure).
Residuals
We can use the PLS regression model to predict the Y values for each of the original X values. We then compare these with the actual Y values. The predicted values are shown in range M153:O157 of Figure 1 using the formula
=MMULT(B153:E157,U133:W136)+U132:W132
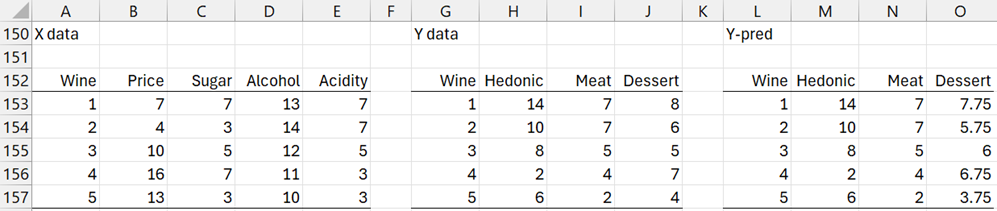
Figure 1 – Predictions (3 latent vector model)
For the Hedonic and Meat columns, Y and Ŷ match and so these residuals are zero. For Dessert, the residuals are .25, .25, -1, .25, .25. Thus, the sum of the squared residuals is SSE = 1.5.
If we use the 2 latent vector model, we obtain the results shown in the upper part of Figure 2.
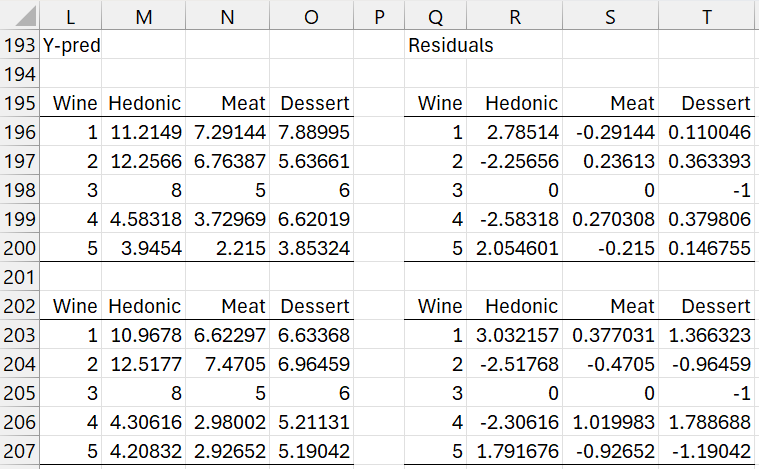
Figure 2 – Residuals (2 and 1 latent vector model)
For the 2 latent vector model SSE = 25.31. The 1 latent vector model is shown in the lower part of the figure and SSE = 34.74.
Predictions
Example 1: Based on the regression from Example 1 of PLS Regression Example, predict the Hedonic, Meat, and Dessert values for the two wines with characteristics shown in Figure 3.
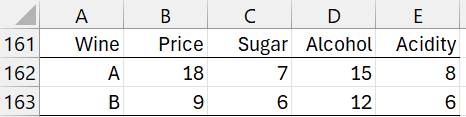
Figure 3 – Two new wines
The approach similar to that described above, although this time since these two wines were not in the original data, we can’t calculate any residuals. Figure 4 contains the predicted values for the 3, 2, and 1 latent vector models.
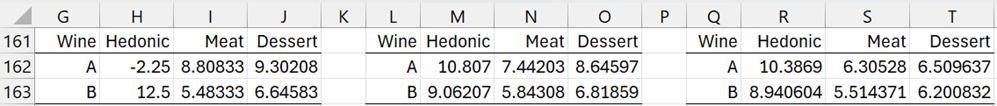
Figure 4 – Predicted Y values
E.g. range H162:J163 contains the formula
=MMULT(B162:E163,U133:W136)+U132:W132
using the regression coefficients for the 3 latent vector model.
Examples Workbook
Click here to download the Excel workbook with various PLS Regression examples, including examples described on this webpage.
References
Hervé Abdi (2003) Partial least squares (PLS) regression
https://www.utdallas.edu/~herve/Abdi-PLS-pretty.pdf
Ng, K. S. (2013) A simple explanation of partial least squares
https://users.cecs.anu.edu.au/~kee/pls.pdf
Kavsek, B. (2002) Partial least squares (PLS) regression and its robustification
https://repositum.tuwien.at/bitstream/20.500.12708/13536/2/Kavsek%20Barbara%20-%202002%20-%20Partial%20least%20squares%20PLS%20regression%20and%20its…pdf