Introduction
It turns out that eigenvectors play an important role in PLS Regression. We illustrate this based on the concepts in PLS Regression Basic Concepts and PLS Regression Example.
See also Eigenvalues and Eigenvectors and Singular Value Decomposition for a more complete description of these concepts.
Note that on this webpage we use A′ to refer to the transpose of matrix A.
Eigenvectors
Vector c, as defined in PLS Regression Basic Concepts is a unit eigenvector corresponding to the largest eigenvalue of (E′F)′(E′F). Similarly, vector w is a unit eigenvector corresponding to the largest eigenvalue of (F′E)′(F′E).
We see this in Figure 1, referencing the first iteration of the NIPALS algorithm in PLS Regression Example. It is also true for iterations 2 and 3.
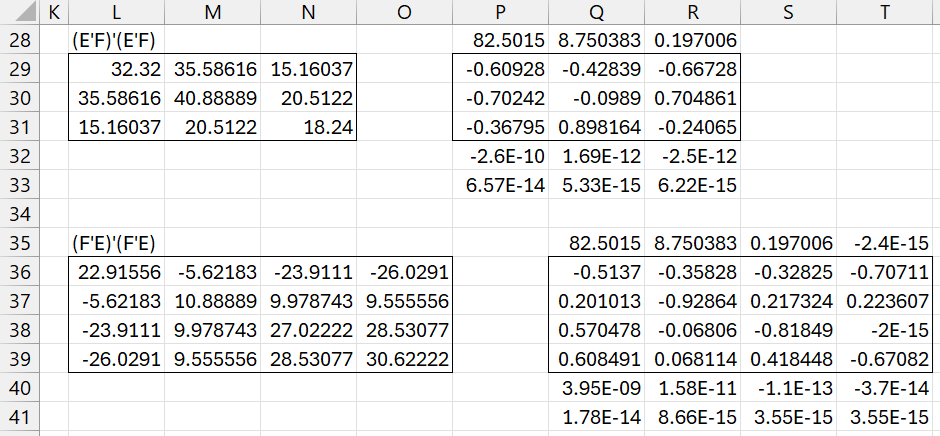
Figure 1 – c and w as eigenvectors
Here, range L29:N31 contains the following formula
=MMULT(MMULT(TRANSPOSE(H13:J17),B13:E17), MMULT(TRANSPOSE(B13:E17),H13:J17))
where ranges B13:E17 and H13:J17 are shown in Figure 2 of PLS Regression Example.
The Real Statistics formula =eigVECTSym(L29:31) produces the results shown in range P28:R33 (see Eigenvalues and Eigenvector Functions). We note that the negative of the vector in range P29:P31 is the same as vector c shown in B119:D121 of Figure 8 in PLS Regression Example. But the negative of a unit eigenvector is also a unit eigenvector, and, in fact, if c is replaced by its negative in all of the PLS regression calculations, the results would be the same.
We also note that the vector in range Q36:Q39 is identical to vector w shown in F119:F122 of Figure 8 in PLS Regression Example.
Singular Value Decomposition
We can also obtain the values in vectors c and w by using SVD.
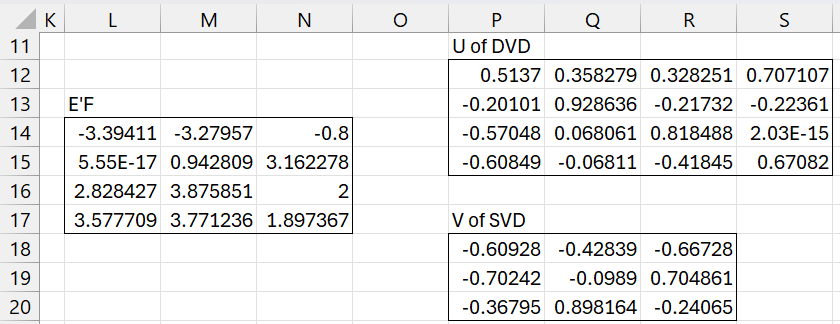
Figure 2 – c and w using SVD
Here range P12:S15 contains the Real Statistics formula =SVD_U(L14:N17,100) and P18:R20 contains =SVD_V(L14:N17,100). Once again the first column of U is w and the first column of V is –c.
Examples Workbook
Click here to download the Excel workbook with various PLS Regression examples, including examples described on this webpage.
References
Hervé Abdi (2003) Partial least squares (PLS) regression
https://www.utdallas.edu/~herve/Abdi-PLS-pretty.pdf
Ng, K. S. (2013) A simple explanation of partial least squares
https://users.cecs.anu.edu.au/~kee/pls.pdf
del Val, D., Berrendero, J. R., Suarez, A. (2023) Relation between PLS and OLS regression in terms of the eigenvalue distribution of the regressor covariance matrix
https://arxiv.org/pdf/2312.01379