Introduction
We start by showing how to test the hypothesis that a particular subset of the independent variables in a multivariate regression model predicts any of the dependent variables.
Basic Concepts
The regression coefficients takes the form

Here β(0) is a (k-q)+1 × m matrix (including β0) and β(1) is a q × m matrix containing the coefficients being tested.
We test the hypotheses
H0: β(1) = O
H1: β(1) ≠ O, i.e. βjp ≠ 0 for some j = (k-q)+1 ,…, k and p = 1, …, m
Then the sum of squares without taking the first (k-q)+1 coefficients into account is
![]()
In fact,
![]()
where
![]()
Alternatively,
![]()
Note that for Wilk’s Lambda

where Λf is the test statistic that the overall regression is significant (as described in Multivariate Regression Hypothesis Testing) and Λr is statistic for the same test but with the model based only on the first the first k-q columns of data.
We can use the same tests as described in Multivariate Regression Hypothesis Testing, except that this time
p = m, h = q, and e = n–k–1
Example
Example 1: Determine whether the last three independent variables (PRW, DBP, QRS) contribute significantly to the multivariate regression model for Example 1 of Multivariate Regression Testing Example.
If we conduct the test described in Multivariate Regression Testing Example but restricted to the first two independent variables GEN and AMT (plus an intercept), we obtain the partial results shown in Figure 1.
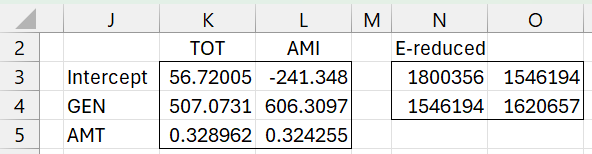
Figure 1 – Reduced model (coefficients + E matrix)
Here range K3:L5 contains the array formula (with reference to Figure 1 of Multivariate Regression Testing Example). E in range N3:O4 is calculated as for E for the full model in range M7:N8 of Figure 2 in Multivariate Regression Testing Example.
=MMULT(MINVERSE(MMULT(TRANSPOSE(A2:F18),A2:F18)), MMULT(TRANSPOSE(A2:F18),G2:H18))
We can again test this model to see whether it provides significant predictive capabilities. We won’t show the details, but the results are summarized in Figure 2.

Figure 2 – Reduced model (significance testing)
All three tests result in a signifcant p-value, indicating that model coefficients in aggregate provide some predictive capability (i.e. significantly more than the intercept-only model). The Roy test also yields a significant result with Θ = .7881 > .5303= Θcrit (based on s = 2 and the same t and u values, and their modifications, as for the full model).
Calculating E and H
This, of course, doesn’t actually say anything about whether the final three independent variables contribute significantly to the model. We now perform this test, as described earlier on this webpage. The initial calculations are shown in Figure 3.
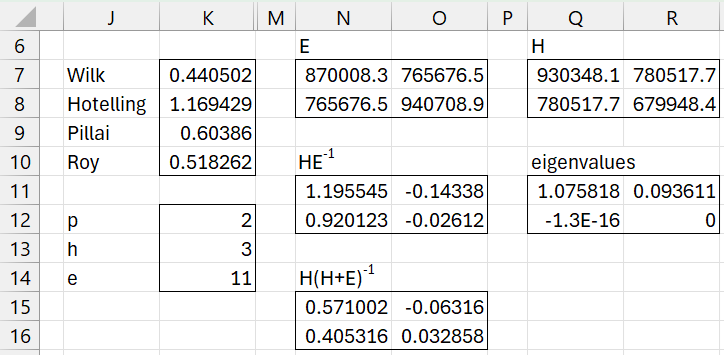
Figure 3 – Subset testing (part 1)
Matrix E in range N7:O8 is copied from M7:N8 of Figure 2 in Multivariate Regression Testing Example. Matrix H in range Q7:R8 is calculated by the formula =N3:O4-N7:O8. All the other entries in Figure 3 are calculated in the same manner as in Figure 2 in Multivariate Regression Testing Example.
Results
We now use the output from Figure 3 to obtain the results shown in Figure 4. The calculations are the same as those shown in Figures 4 through 7 of Multivariate Regression Testing Example.
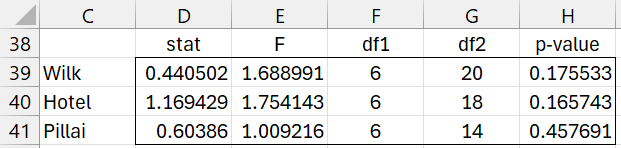
Figure 4 – Subset testing (part 2)
This time, we see that none of the p-values indicate a significant result, and so we conclude that the last three independent variables don’t significantly contribute to the multivariate regression model. The Roy test also yields a non-significant result with Θ = .518 < .565= Θcrit based on s = 2, t = 0, and u = 4 (actually u = 5 since the table of critical values doesn’t support u < 5).
Examples Workbook
Click here to download the Excel workbook with the examples described on this webpage.
References
Johnson, R. A., Wichern, D. W. (2007) Applied multivariate statistical analysis. 6th Ed. Pearson
https://mathematics.foi.hr/Applied%20Multivariate%20Statistical%20Analysis%20by%20Johnson%20and%20Wichern.pdf
Rencher, A.C., Christensen, W. F. (2012) Methods of multivariate analysis (3nd Ed). Wiley
Junker, B. (2005) Multivariate regression, MANOVA
https://www.stat.cmu.edu/~brian/722-2005/week04/07-reg-topics2.pdf
Helwig, N. E. (2017) Multivariate linear regression
http://users.stat.umn.edu/~helwig/notes/mvlr-Notes.pdf