Objective
The Real Statistics Resource Pack provides a number of worksheet functions to support multivariate regression in Excel. We describe these functions and show how you can use them to obtain some of the hypothesis testing results shown elsewhere on this website.
Once again, we use the data in Figure 1, where the first 5 columns contain the data for the independent variables and the last 2 columns contain the data for the dependent variables.
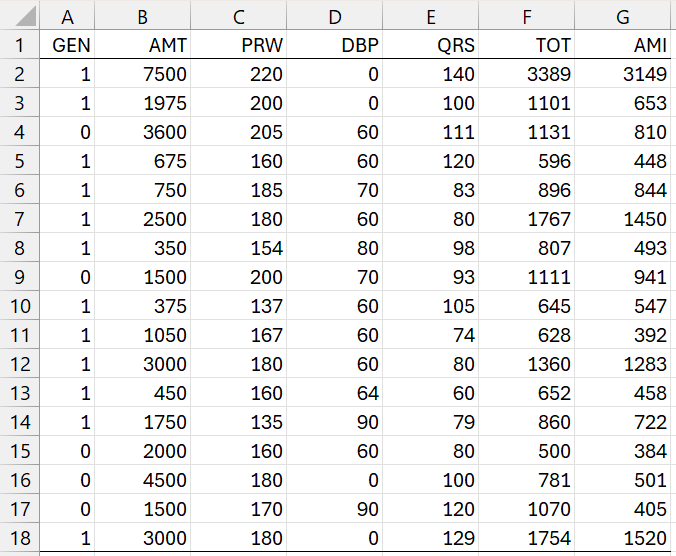
Figure 1 – Example Data
Regression Coefficients
MRegCoeff(Rx, Ry, head): returns a k × m array with the coefficients of the multivariate regression model defined by the X data in Rx and Y data in Ry. Rx has k columns, Ry has m columns, and Rx and Ry have the same number of rows.
If head = TRUE (default FALSE), then Rx and Ry contain column headings and these are appended as row and column headings to the output.
Example
We can use the formula =MRegCoeff(A1:E18,F1:G18,TRUE) to output the multivariate regression coefficients based on the data in Figure 1.
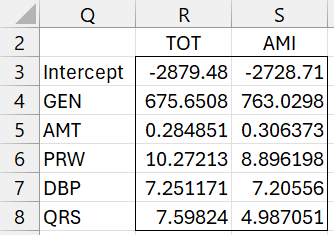
Figure 2 – Multivariate Regression Coefficients
Note that this output matches that shown in Figure 2 of Multivariate Regression Testing Example.
Table Lookup
The Real Statistics Resource Pack provides the following table lookup worksheet functions to output the .05 critical value for the Wilk, Hotelling. Pillai and Roy tests.
WilkCRIT(p, h, e) = critical value for Wilk’s test based on the p, h, and e parameters
HotelCRIT(p, h, e) = critical value for Hotelling’s test based on the p, h, and e parameters
PillaiCRIT(s, t, u) = critical value for Pillai’s test based on the s, t, and u parameters
RoyCRIT(s, t, u) critical value for Roy’s test based on the s, t, and u parameters
The Real Statistics Resource Pack uses internal critical value tables to support these functions. The Johnson and Wichern (2007) reference below contains these tables.
Interpretation
For the Wilk test, a critical value greater than the Wilk Lambda Trace statistic, Λ < Λcrit, indicates a significant result (reject the null hypothesis). For the other three tests, a critical value less than the test statistic indicates a significant result.
Examples
As we see in Figure 7 of Multivariate Regression Testing Example, the formula =RoyCRIT(2,1,5) returns the value .651, while the formula =RoyCRIT(2,1,4) returns the value -.651, indicating that the best estimate for the critical value when s = 1, t = 1, and u = 4 is the value when u = 4 is replaced by u = 5.
Also, as mentioned following Figure 7 on that webpage, =RoyPillai(2,1,4) returns the value .991.
Hypothesis Testing
For these worksheet functions, Rx is an array containing X data and Ry is an array containing Y data. These arrays don’t contain column headings.
MRegSig0(Rx, Ry, lab): returns an array with the Wilk, Hotelling, Pillai, and Roy test statistics to test whether the variables in Rx add significantly to a multivariate regression model for Rx and Ry. For each of the first three tests, the test statistic, approximate F-stat, df1, df2, p-value, and .05 critical value are returned.
For the Roy test, the test statistic, s, t, and u parameter values are returned along with the .05 critical value. If any of the parameters are outside of the bounds in the critical value table, the nearest s, t, or u value is used and the entry “est” precedes the .05 critical value.
If lab = TRUE (default FALSE), then row and column headings are appended to the output.
MRegSigX(Rx, Ry, lab, q): returns an array with the Wilk, Hotelling, Pillai, and Roy test statistics to test whether the last q variables (default 1) in Rx add significantly to a multivariate regression model for Rx and Ry. The output is similar to that described for MRegSig0.
MRegSig1(Rx, Ry, lab, q): returns an array with the Wilk, Hotelling, Pillai, and Roy test statistics to test whether the qth variable (default 1) in Rx add significantly to a multivariate regression model for Rx and Ry. The output is similar to that described for MRegSig0.
MRegSig(Rx, Ry, xhead): returns an array whose rows provide a significance test for each of the k variables in Rx based on the multivariate regression model for Rx and Ry. Each row contains the Wilk statistic, F-stat, df1, df2, p-value, and .05 critical value for one of the variables in Rx. xhead is optional 1 × k array. If included, it provides the names of the variables in Rx and these are used to provide row headings in the output (in this case, column headings are also included in the output).
Examples
To obtain the results of Example 1 of Multivariate Regression Testing Example, we can use the formula =MRegSig0(A2:E18,F2:G18,TRUE) to obtain the results shown in Figure 3.
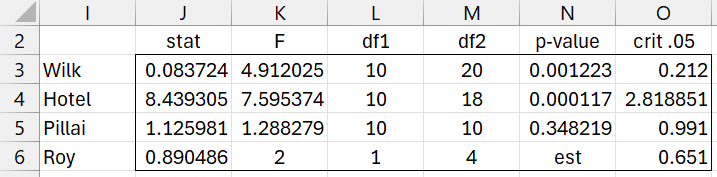
Figure 3 – Testing model significance
To obtain the results of Example 1 of Testing a Subset of Multivariate Regression Coefficients, we can use the formula =MRegSigX(A2:E18,F2:G18,TRUE,3) to obtain the results shown in Figure 4.
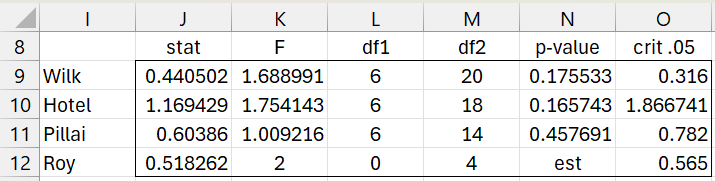
Figure 4 – Testing significance of last 3 coefficients
We can use the formula =MRegSig1(A2:E18,F2:G18,TRUE,2) to test the significance of the AMT variable, as shown in Figure 5.
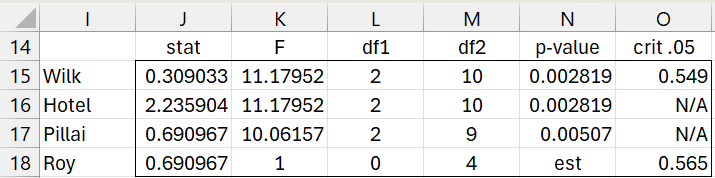
Figure 5 – Testing significance of the 2nd coefficient
We see that based on all four tests for this variable are significant.
Finally, we show in Figure 6 the significance of each of the 5 independent variables using the Wilk’s test.
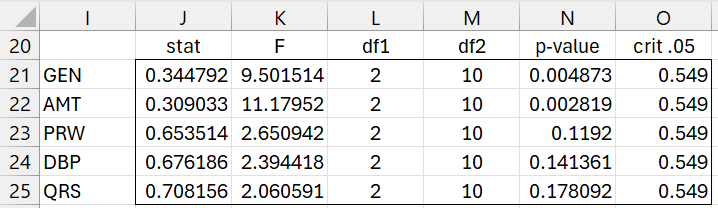
Figure 6 – Testing significance of all variables
Examples Workbook
Click here to download the Excel workbook with the examples described on this webpage.
References
Johnson, R. A., Wichern, D. W. (2007) Applied multivariate statistical analysis. 6th Ed. Pearson
https://mathematics.foi.hr/Applied%20Multivariate%20Statistical%20Analysis%20by%20Johnson%20and%20Wichern.pdf
Rencher, A.C., Christensen, W. F. (2012) Methods of multivariate analysis (3nd Ed). Wiley