Introduction
In Multivariate Hypothesis Testing we explain how to test the hypothesis that none of the independent variables in a multivariate regression model predicts any of the dependent variables. We now provide an example of how to perform this test in Excel.
Example
Example 1: Determine whether the regression model from Example 1 of Confidence Intervals for Multivariate Regression Coefficients is significant.
We repeat the data for the example in Figure 1.
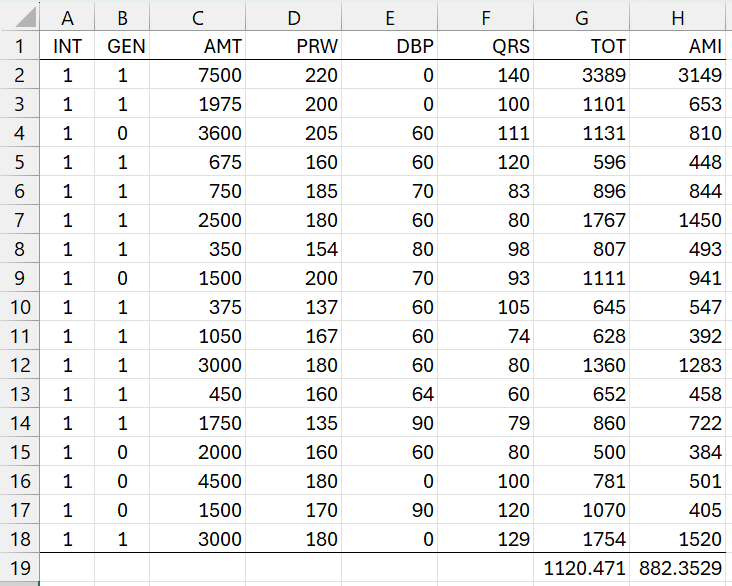
Figure 1 – Amitriptyline Data
We have also included a column of ones for the intercept (A2:A18), and the means of the data for the two dependent variables, TOT and AMI (in G19:H19).
We begin the analysis as shown in Figure 2.
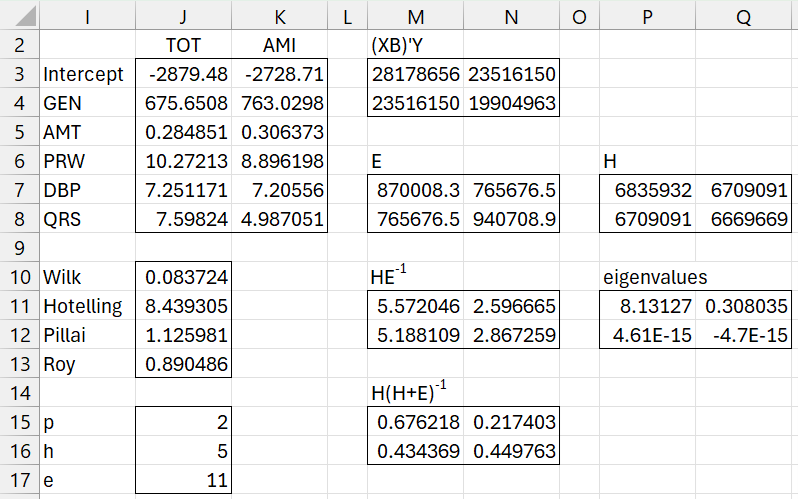
Figure 2 – Hypothesis Testing (part 1)
The formulas used in Figure 2 are shown in Figure 3.
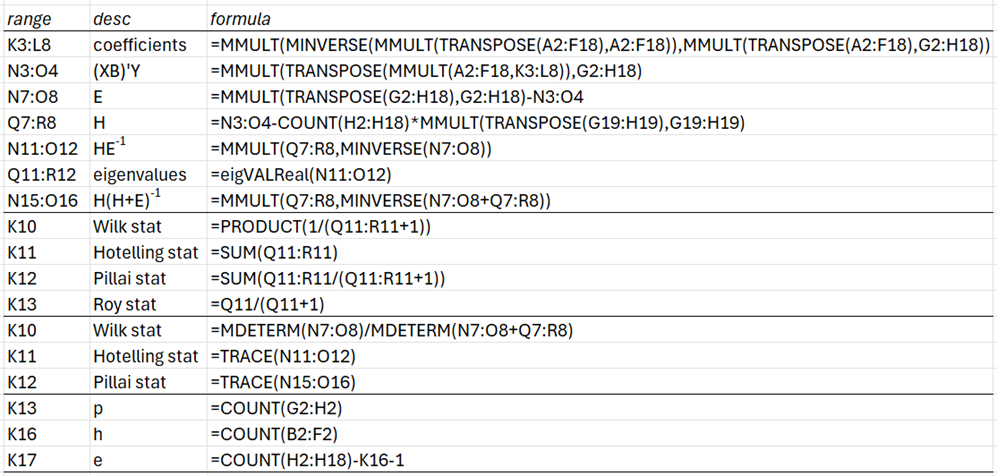
Figure 3 – Formulas from Figure 2
Figure 3 shows two ways to compute the Wilk’s, Hotelling, and Pillai test statistics.
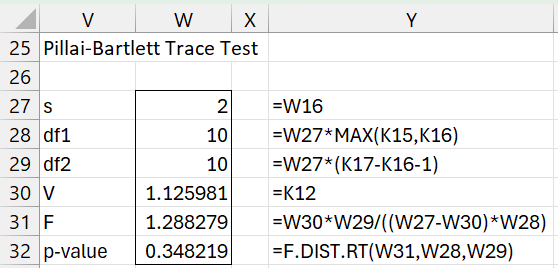
We now show how to determine whether any of the four test statistics show a significant result by using an F-test approximation (as we do for MANOVA). See Figures 4 through 7.
Wilk and Hotelling’s Tests
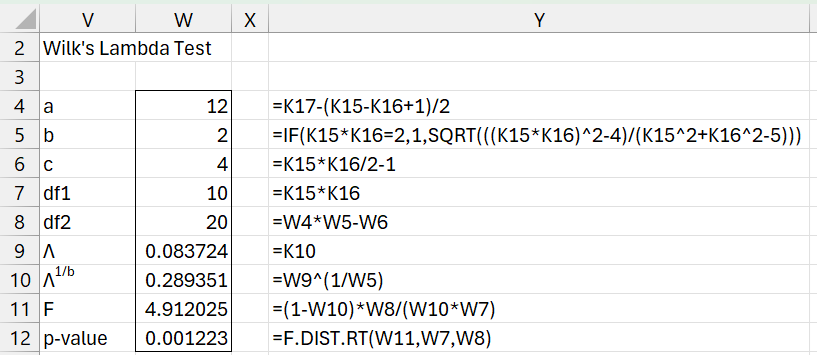
Figure 4 – Wilk’s Lambda Test
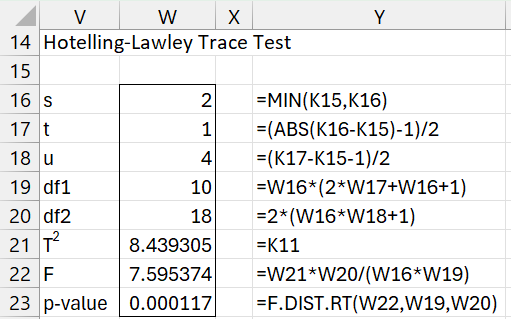
Figure 5 – Hotelling-Lawley Test
Pillai-Bartlett and Roy Tests
Figure 6 – Pillai-Bartlett Test
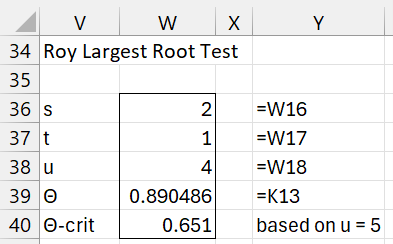
Figure 7 – Roy’s Largest Root Test
The table of critical values for Roy’s test doesn’t have an entry for less than u = 5. If we use u = 5 instead of u = 4, then Θ = .890486 > .651 = Θcrit, which rejects the null hypothesis. Actually, we can obtain this result by using the Real Statistics formula =RoyCRIT(2, 1, 4).
Three of the four tests show a significant result. Only Pillai’s test is different with p-value = .324. Actually, if we consult a table of critical values for the Pillai test, we obtain a significant result. In fact, the Real Statistics formula =PillaiCRIT(2, 1, 4) produces a value of Vcrit = .991, but V = 1.25981 > .991 = Vcrit, which is a significant result.
You can obtain more information about the critical values for these statistics at Real Statistics Support for Multivariate Regression.
Examples Workbook
Click here to download the Excel workbook with the examples described on this webpage.
References
Johnson, R. A., Wichern, D. W. (2007) Applied multivariate statistical analysis. 6th Ed. Pearson
https://mathematics.foi.hr/Applied%20Multivariate%20Statistical%20Analysis%20by%20Johnson%20and%20Wichern.pdf
Rencher, A.C., Christensen, W. F. (2012) Methods of multivariate analysis (3nd Ed). Wiley