Example
Example 1: A study was conducted to see the impact of social-economic class (rich, middle, poor) and gender (male, female) on kindness and optimism using a sample of 24 people based on the data in Figure 1.
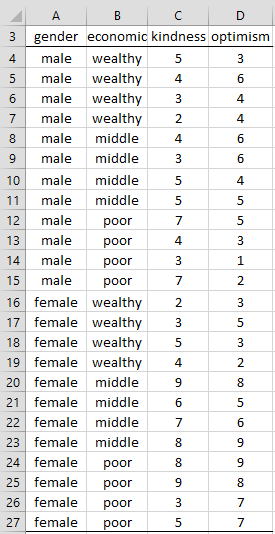
Figure 1 – Two Factor MANOVA data
Data Analysis Tool
Real Statistics Data Analysis Tool: We conduct the analysis for Example 1 by pressing Ctrl-m and selecting MANOVA: Two factors from the Multivar tab. Next fill in the dialog box that appears as shown in Figure 2.
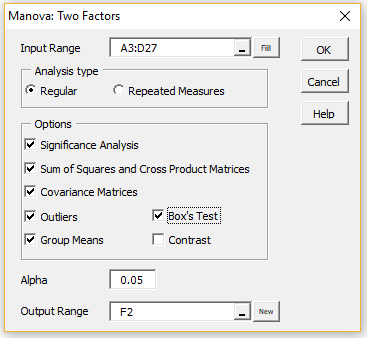
Figure 2 – Two Factor MANOVA dialog box
The output is as shown in Figures 3, 4, and 5.
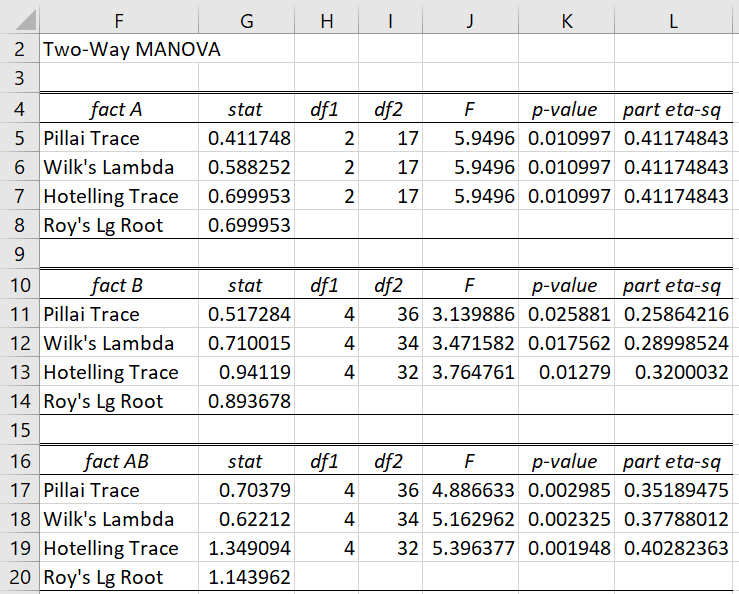
Figure 3 – Main MANOVA output
We see from Figure 3 that the interaction between the two factors is significant (although the tests on the individual factors are not significant).
We show the various SSCP and covariance matrices in Figure 4.
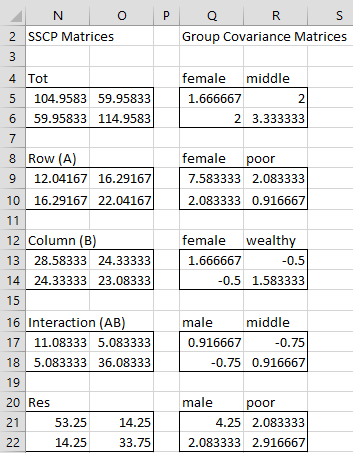
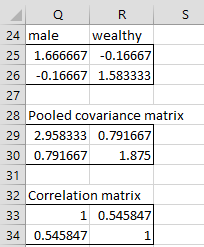
Figure 4 – SSCP and Covariance matrices
The Mahalanobis test for outliers is shown on the left side of Figure 5. Only the first 10 data elements are shown, although the full test shows that none of the data vectors is an outlier.
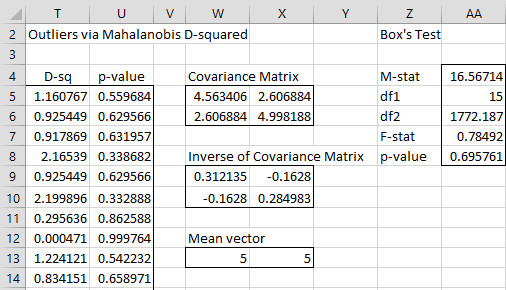
Figure 5 – Mahalanobis and Box tests
The Box test on the right side of Figure 5 shows that the assumption of equal covariance matrices holds.
See Two-way MANOVA Functions for information about how the values in Figures 3, 4, and 5 are calculated.
Examples Workbook
Click here to download the Excel workbook with the examples described on this webpage.
References
Penn State University (2022) Two-way MANOVA additive model and assumptions. Applied Multivariate Statistical Analysis
https://online.stat.psu.edu/stat505/lesson/8/8.10
Penn State University (2022) Forming a MANOVA table. Applied Multivariate Statistical Analysis
https://online.stat.psu.edu/stat505/lesson/8/8.11
Anderson, C. J. (2017) MANOVA: Part 2. Profile Analysis and 2-way MANOVA
https://education.illinois.edu/docs/default-source/carolyn-anderson/edpsy584/lectures/manova_part2_beamer-online.pdf
When applying this method manually I received different values for the Fact B and Fact AB wilks statistic.
I got 0.50412 for Fact B and 0.38703 for fact AB.
I’m not sure how i could have received different value to yours as all the other values are correct and the sscp matrices are identical.
For fact B the lambda for the wilks is the determinant of SSCP RES divided by determinant of (SSCP Column + SSCP RES). no matter how I try this i get the values I mentioned previously so was wondering what it is i’m missing.
Any help is greatly appreciated 🙂
Hello Leon,
Can you send me an Excel spreadsheet with your calculations?
Charles
Hey, I’m unable to attach a spreadsheet but the calculations I’m struggling with are the wilks tests for fact B and AB.
Using the SSCPs in your example:
MDeterm(Res)/MDeterm(Res+Row(A))) = 0.588252
MDeterm(Res)/MDeterm(Res+Colum(B))) = 0.504121
MDeterm(Res)/MDeterm(Res+Interaction(AB))) = 0.387033
My formulas match this identically but as you can see only the first matches the output you’ve stated in figure 3.
I’m not sure where the other values in this figure could come from.
I’m not able to use your excel addon so need to do this manually (excluding the Roy).
sorry for not being able to attach the excel 🙂
Hi Leon,
I have now included a link to the Excel spreadsheet that I have used to create the example. Hopefully, this will provide you with all the information you need.
Charles