Basic Concepts
With time-series data, when we plot the residuals against time, in what is called a time sequence plot, we expect to see a random pattern for data that is not autocorrelated. Otherwise, the data is autocorrelated. E.g. for the data in Example 1 of Introduction to Autocorrelation, we get the time sequence plot shown on the right side of Figure 1. Clearly, this is not a random pattern.

Figure 1 – Line chart of first-order autocorrelation
Scatter Plot
This is probably easier to see by creating a plot of the pairs used to calculate the first-order autocorrelation, as shown in Figure 2.
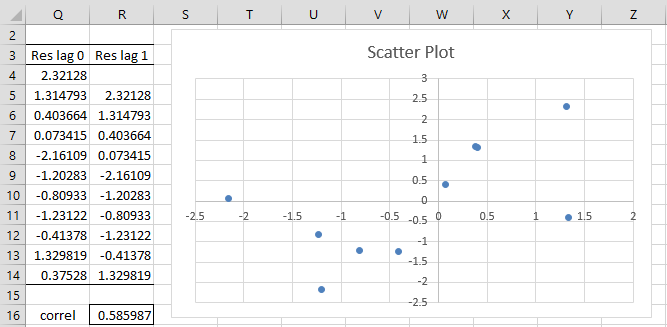
Figure 2 – Scatter diagram for first-order autocorrelation
Examples Workbook
Click here to download the Excel workbook with the examples described on this webpage.
References
Geeks for Geeks (2025) AutoCorrelation
https://www.geeksforgeeks.org/machine-learning/autocorrelation/
Wooldridge, J. M. (2013) Introductory econometrics, a modern approach (fifth edition). Cengage Learning
https://faculty.cengage.com/works/9781337558860