Data Analysis Tool
Real Statistics Data Analysis Tool: We can use the Real Statistics Breusch-Godfrey and Newey-West data analysis tool to test for autocorrelation and to calculate the Newey-West standard errors.
We now show how to use this data analysis tool for Example 1 of Newey-West Standard Errors, whose data is repeated in Figure 1.
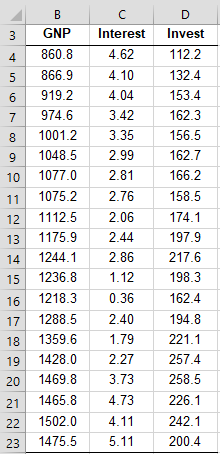
Figure 1 – Regression data
Press Ctrl-m and select the Breusch-Godfrey and Newey-West option from the Reg tab (or from the Regression option when using the original user interface). Now fill in the dialog box that appears as shown in Figure 2.
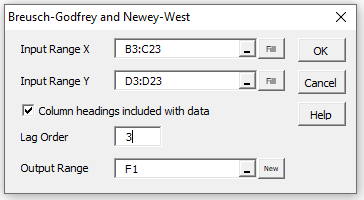
Figure 2 – Breusch-Godfrey and Newey-West dialog box
Note that if the Lag Order field were left blank it would default to .75 × n1/3, which for this example is .75 × 201/3 = 2.034, which would round up to 3.
Results
Upon pressing the OK button the output shown in Figure 3 appears.

Figure 3 – Output from the data analysis tool
We see from the left side of the figure that both versions of the Breusch-Godfrey test are significant, indicating that there is autocorrelation. The regression shown on the right side of the figure uses both OLS coefficient standard errors as well as Newey-West standard errors.
Examples Workbook
Click here to download the Excel workbook with the examples described on this webpage.
References
Stata (2018) Regression with Newey–West standard errors
https://www.stata.com/manuals13/tsnewey.pdf
Ao, X. (2009) Heteroskedasticity and autocorrelation consistent standard errors
https://www.hbs.edu/research-computing-services/Shared%20Documents/Training/hac.pdf
Wooldridge, J. M. (2013) Introductory econometrics, a modern approach (fifth edition). Cengage Learning
https://faculty.cengage.com/works/9781337558860
Wikipedia (2018) Breusch-Godfrey test
https://en.wikipedia.org/wiki/Breusch%E2%80%93Godfrey_test