Objective
On this webpage we explore forecasts obtained from the multinomial logistic regression model obtained in Multinomial Regression using Binary Logistic Regression.
Forecasts
Figure 1 displays the forecasted probabilities of the three outcomes for men and women at a dosages of 24 mg and 24.5 mg. These forecasts are based on the coefficients shown in Figure 6 of Multinomial Regression using Binary Logistic Regression.
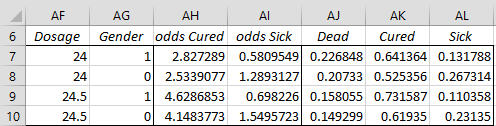
Figure 1 – Forecasted probabilities
From Figure 1, we see that the multinomial logistic regression model forecasts that 22.7% of women who receive a dosage of 24 mg will die, 64.1% will be cured and 13.2% will be sick. This compares with 12/63 = 19% of the sample women who receive a dosage will die, 15/63 = 24% who will be cured and 36/63 = 57% who will be sick. Even though we have no sample data for 24.5 mg the model produces the forecast shown in Figure 1.
Figure 2 shows formulas used to produce the first forecast in Figure 1.
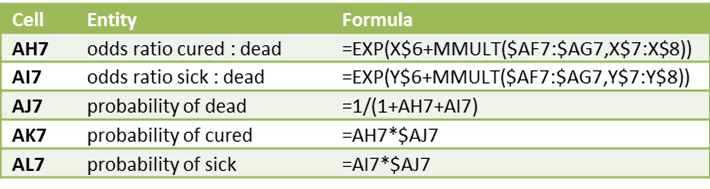 Figure 2 – Key formulas for Figure 1
Examples Workbook
Click here to download the Excel workbook with the examples described on this webpage.
References
Wikipedia (2014) Multinomial logistic regression
https://en.wikipedia.org/wiki/Multinomial_logistic_regression
Field, A. (2005) Discovering Statistics Using SPSS. 3rd ed. Sage
https://profandyfield.com/discoverse/dsus/
Cheng, H., (2021) Multinomial logistic regression
https://bookdown.org/chua/ber642_advanced_regression/multinomial-logistic-regression.html
Agresti, A. (2002) Categorical data analysis, Wiley & Sons