Basic Concepts
Log-linear models for two-way contingency tables, only provide another way of looking at the chi-square analyses studied in Independence Testing. Since the traditional chi-square test is not available for three-way tables, log-linear models become an important way to analyze such tables. We now extend the approach used in Two-way Contingency Tables to three-way contingency tables.
For three-way contingency tables, we examine log-linear regression models of the following form:
where all the xij are dummy variables coded to represent categorical variables and the yi are used to express the frequency of outcomes. In addition, we also include more complicated models that contain factors consisting of interactions between the same variables.
Figure 1 shows the possible hierarchical log-linear models for three-way contingency tables.

We now show how to use log-linear models for three-way contingency tables using an expanded version of Example 2 of Independence Testing.
Example
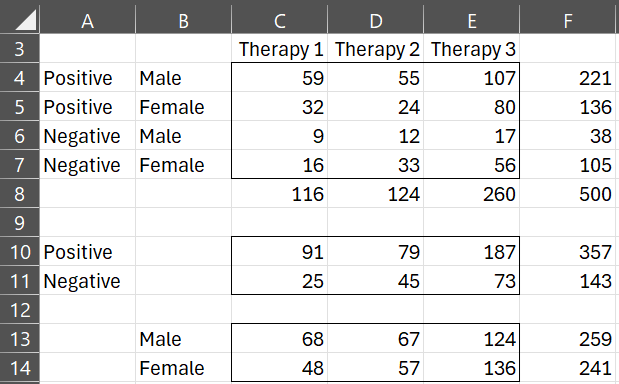
Example 1: A researcher wants to know whether there is a significant difference among three therapies for curing patients of cocaine dependence (defined as not taking cocaine for at least 6 months). She tests 500 patients and obtains the results shown in Figure 2. Determine which of the above models is the most parsimonious fit for the data.
Figure 2 – Contingency table for Example 1
There are three variables in the table: Cure (C), Gender (G) and Therapy (T). Cure can take the value Positive (i.e. the patient was cured) or Negative (i.e. the patient was not cured), Gender is Male or Female and Therapy is any one of three therapies used to treat the patient. The variables are similar to factors in ANOVA. The different values for each factor are similar to the levels in ANOVA. Whereas ANOVA characterizes variation, log-linear models characterize frequencies.
Figure 2 displays counts of patients that meet each of the 2 × 2 × 3 different combinations of the three variables. In addition, totals are given for each combination of variables.
Just as for two-way contingency tables, the saturated model provides a complete characterization of the data equivalent to the information in Figure 2. What we are looking for is the smallest model that is a significantly good fit for the data.
Topics
We will look at each of the models in Figure 1, one by one, to determine which is best. See the following for more details:
- Saturated model
- Conditional independence model
- Partial independence model
- Mutual independence model
- Homogeneous association model
- Non-comprehensive models
- Best fit model
Examples Workbook
Click here to download the Excel workbook with the examples described on this webpage.
Reference
Howell, D. C. (2010) Statistical methods for psychology (7th ed.). Wadsworth, Cengage Learning.
https://labs.la.utexas.edu/gilden/files/2016/05/Statistics-Text.pdf

This is very helpful, thank you!
dai epuraa neega
Sorry, but I don’t understand your comment.
Charles
Otha
onnum puriyala
I am share Tweet
Not English