Objective
As can be seen from Figure 2 of Split-plot Tools, the Split-plot data analysis tool supports two other RCBD models (RCB 1 and RCB 2) and a CRD model. We now describe these three models.
RCB 1 and 2 models
The RCB 1 model is the same as the RCB model, except that Whole plot × Subplot is used as the error term for the Subplot factor, and so the formula in cell W8 is =V8/V9 (instead of =V8/V10).
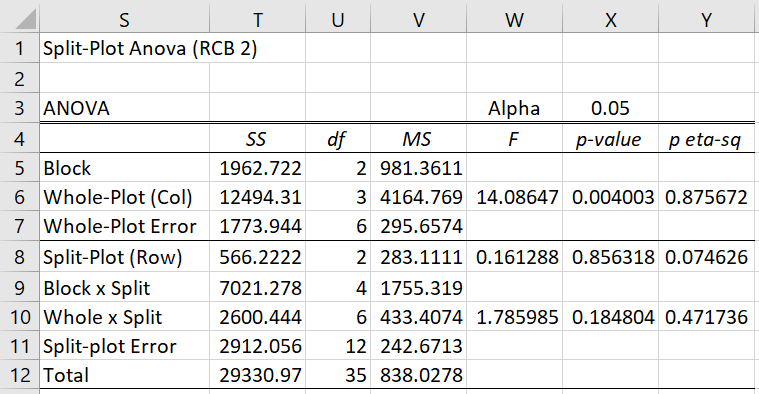
The analysis for the RCB 2 model of Example 1 of Split-plot Tools is shown in Figure 1.
Figure 1 – RCB 2 Split-plot Model
In this model, the Block × Split term is separated out from the Split-plot Error term. Cell W8 contains the formula =V8/V9 and W10 contains the formula =V10/V11. This is the model used in Montgomery (2001).
CRD model
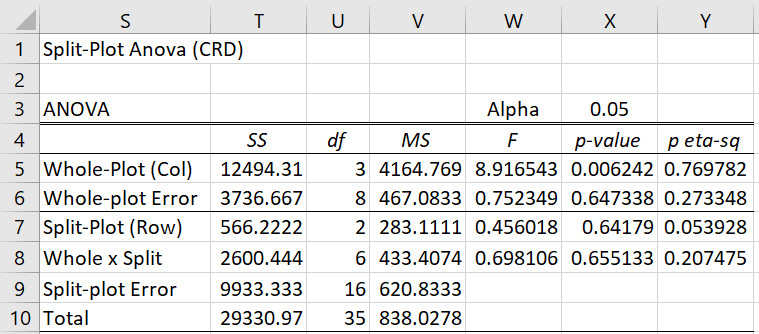
The final model is the Complete Randomized Design (CRD) Split-plot model as described in Split-plot Design. For Example 1 of Split-plot Tools, the analysis is as shown in Figure 2.
Figure 2 – CRD Split-plot Model
Cell W5 contains the formula =V5/V6, cell W6 contains the formula =V6/V9, cell W7 contains the formula =V7/V9 and cell W8 contains the formula =V8/V9.
Examples Workbook
Click here to download the Excel workbook with the examples described on this webpage.
References
Montgomery, D. C. (2012) Design and analysis of experiments. 8th ed. Wiley
https://faculty.ksu.edu.sa/sites/default/files/douglas_c._montgomery-design_and_analysis_of_experiments-wiley_2012_edition_8.pdf
Zhang, H. (2022) Split plot design
https://www.stat.purdue.edu/~zhanghao/STAT514/Lecture_Notes/LectureNotes20-Split-plot-Designs-.html#:~:text=A%20split%2Dplot%20design%20is,randomly%20assigned%20to%20split%2Dplots.
Hale, I. (2025) Split plot design
https://www.unh.edu/halelab/ANFS933/Readings/Topic12_Reading1.pdf


Hello, Dear Sir/Madam.
I am an Agronomist before I did some research about the Date of planting, Seed Rate, different doze Effect of fertilizer on yield, space plant to plant & row to row. So I want to have a new title & design for Agronomic experiments, especially about chich pea crop & other puls crops. I need your help and kindness.
With Regards.
What sort of help do you need?
Charles