Basic Concepts
For large samples, AUC (area under the curve for a ROC curve) is approximately normally distributed, and so a 1-α confidence interval for AUC may be calculated as described in Confidence Interval for Sampling Distributions.
The confidence interval is equal to AUC ± se · zcrit where zcrit is the two-tailed critical value of the standard normal distribution, as calculated in Excel by =NORM.S.INV(1-α/2) and
where n1 and n2 are the sizes of the two samples and
![]()
Example
Example 1: Find the 95% confidence for the AUC from Example 1 of Classification Table.
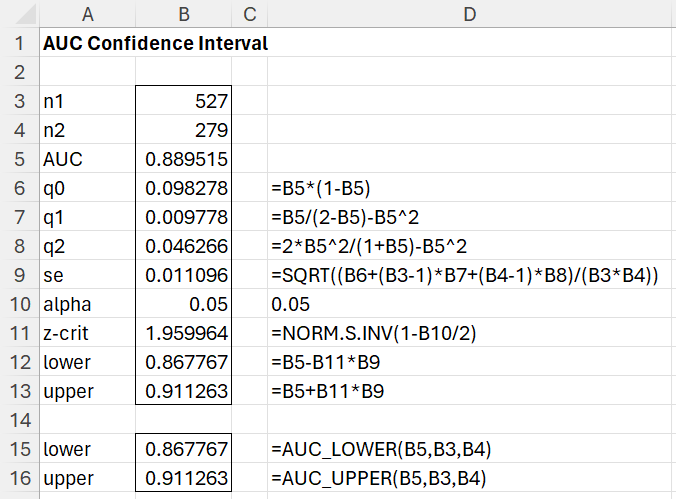
From Figure 1 of ROC Curve, we see that n1 = 527 (# of observed failures), n2 = 279 (# of observed successes), and AUC = .889515. The 95% confidence interval of AUC is (.867767, .911263), as shown in Figure 1.
Figure 1 – AUC 95% Confidence Interval
Worksheet Functions
Real Statistics Functions: The Real Statistics Resource Pack contains the following functions:
AUC_LOWER(auc, n1, n2, α) = the lower limit of the 1-α confidence interval for the area under the curve = auc for samples of size n1 and n2
AUC_UPPER(auc, n1, n2, α) = the upper limit of the 1-α confidence interval for the area under the curve = auc for samples of size n1 and n2
If the α argument is omitted it defaults to .05.
For Example 1, we see that =AUC_LOWER(B5, B3, B4) calculates the value shown in cell B12 and =AUC_UPPER(B5, B3, B4) calculates the value shown in cell B13.
Examples Workbook
Click here to download the Excel workbook with the examples described on this webpage.
References
Hanley, J. A., McNeil, B. J. (1982) The meaning and use of the area under a receiver operating characteristic (ROC) curve
https://pubmed.ncbi.nlm.nih.gov/7063747/
Hintze, J. L. (2008) ROC Curves. NCSS
https://www.ncss.com/wp-content/themes/ncss/pdf/Procedures/NCSS/ROC_Curves-Old_Version.pdf
Hintze, J. L. (2022) One ROC curve and cutoff analysis. NCSS
https://www.ncss.com/wp-content/themes/ncss/pdf/Procedures/NCSS/One_ROC_Curve_and_Cutoff_Analysis.pdf
IBM (2011) ROC algorithms IBM SPSS Statistics Algorithms
https://public.dhe.ibm.com/software/analytics/spss/documentation/statistics/24.0/en/client/Manuals/IBM_SPSS_Statistics_Algorithms.pdf


Hi Charles,
Thank you for the great introduction of CI for the AUCROC and the Excel workbook! I think it can be better if the defination of n1 and n2 is more clear. According to the original paper, n1 regards to “number of abnormal samples” (or positive) and n2 regards to “number of normal samples” (or negative). Reversing these two values can lead to different CIs.
Best,
Ruting
Hello Ruting,
First of all, I would like to apologize for my late response.
I have now added information about what n1 and n2 refer to. Keep in mind that “positive” and “negative” are relative terms, and what is normal can be considered by some as negative and by others positive, and similarly for abnormal.
Reversing these may lead to different results.
It is important that what the terms mean are clearly identified. I have tried to enact your suggestion and label things better.
Charles
Hi Charles,
Excellent website! I visit your website often and it is very helpful. I would lkie to let you know though there is a typing error on this page. The AUC for example 1 is .889515, not .88915.
Wenxiang
Hello Wenxiang,
Thank you for your kind words about the website.
Also, thank you for spotting the error on the webpage. I have now corrected the page as you have suggested.
I appreciate your valued support.
Charles