Objective
We describe Excel worksheet functions supplied by the Real Statistics Resource Pack that supports Correlation Testing for three or more samples.
Worksheet Functions
The Real Statistics Resource Pack provides the following worksheet functions that supports the various analyses described in Correlation Testing for more than Two Samples. Here Rr is a k × 1 column array with the correlation coefficient for each of k samples and Rn is a k × 1 column array with the corresponding sample sizes.
MCORREL_TEST(Rr, Rn, lab): returns an array with the following values: chi-square test statistic using method 1 and the corresponding p-value, chi-square test statistic using method 2 and the corresponding p-value, df, weighted correlation (rw).
If lab = TRUE (default FALSE), then a column of labels is appended to the output.
MCORREL_TEST0(Rr, Rn, rho, fish) = p-value for the test the null hypothesis that the weighted rho = rho.
rho defaults to zero. If fish (default TRUE) then the Fisher transformation approach is used. If fish = FALSE then rho is assumed to be zero.
MCORREL_TUKEY(Rr, Rn): returns an array with row and column labels with the results of the C(k,2) possible Tukey HSD comparisons
MCORREL_DUNNETT(Rr, Rn): returns an array with row and column labels with the results of the k-1 Dunnett’s test comparisons assuming that sample 1 is the control
MCORREL_CONTRAST(Rr, Rn, Rc, lab): returns an array with the values: z,-stat, s.e., c-stat, df, p-value for the contrast analysis based on the k × 1 contrast array; note that c-stat is the C-sq test statistic.
Examples
We now duplicate the results of the various examples shown in Correlation Testing for more than Two Samples using these worksheet functions.
Null hypothesis is not rejected
Figure 1 shows tests when the null hypothesis is not rejected.
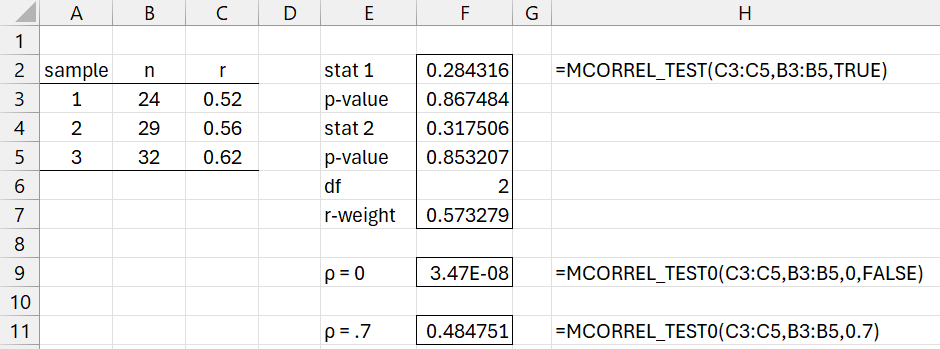
Figure 1 – Tests when null hypothesis is not rejected
Null hypothesis is rejected
Figure 2 shows the Tukey HSD and Dunnett’s follow-up tests when the null hypothesis is rejected.
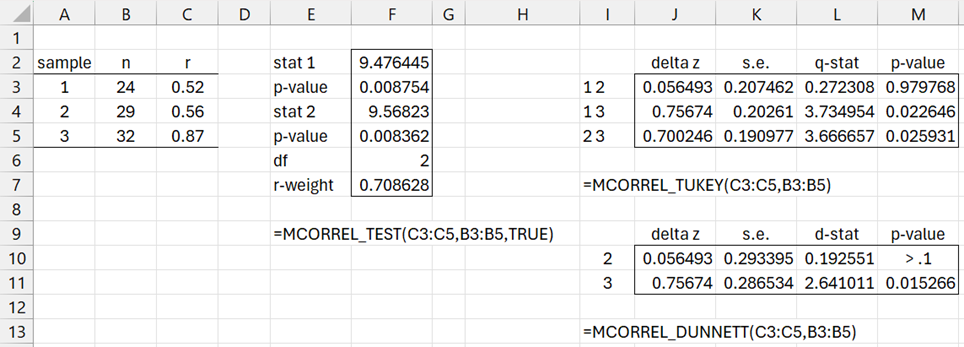
Figure 2 – Tests when null hypothesis is rejected
Finally, Figure 3 shows an example of the use of contrasts.
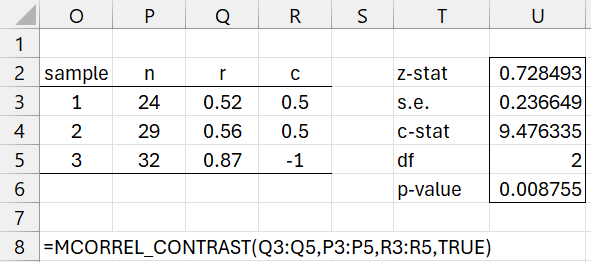
Figure 3 – Contrast example
Examples Workbook
Click here to download the Excel workbook with the examples described on this webpage.
Reference
Zar, J. H. (2010) Biostatistical analysis 5th Ed. Pearson
https://www.scribd.com/document/481055909/