Objectives
This webpage displays tables of effect sizes and sample sizes for the JZS version of the Bayesian t-test. The workbook link below provides access to similar tables for the weakly informational and Jeffreys’ versions of the Bayesian t-test. See Bayesian t Test Sample Size for more details.
Tables of Effect Sizes
Figure 1 presents a table of effect sizes for various values of BF and n using JZS_EFFECT.
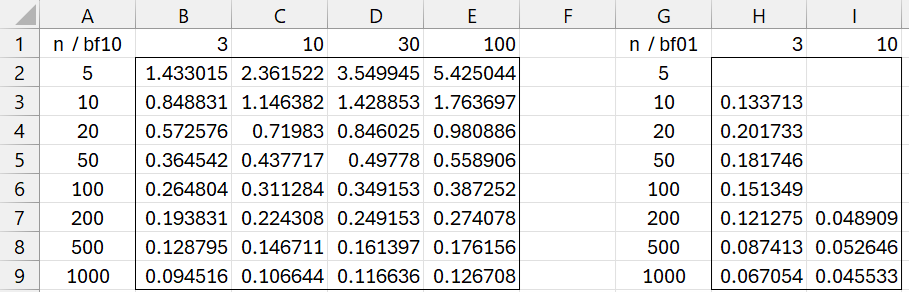
Figure 1 – Table of effect sizes (one-sample case)
The table on the left displays the minimum effect sizes required to support the alternative hypothesis, while the table on the right displays the maximum effect sizes in support of the null hypothesis.
For example, cell B2 contains the formula =JZS_EFFECT(B$1,$A2) and cell H3 contains the formula = JZS_EFFECT(1/H$1,$G3).
Figure 2 presents a table of effect sizes for various values of BF and n using JZS_EFFECT for two independent samples of the same size.
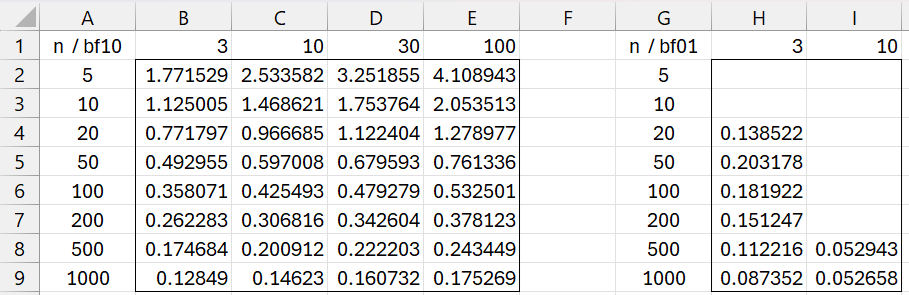
Figure 2 – Table of effect sizes (two-sample case)
For example, cell C5 contains the formula =JZS_EFFECT(C$1,$A5,$A5). Cell H4 contains the formula JZS_EFFECT(1/H$1,$A4,$A4).
Tables of Sample Sizes
The table of minimum sample sizes n required to support (based on BF10) the alternative hypothesis at various effect size δ levels is provided in Figure 3.
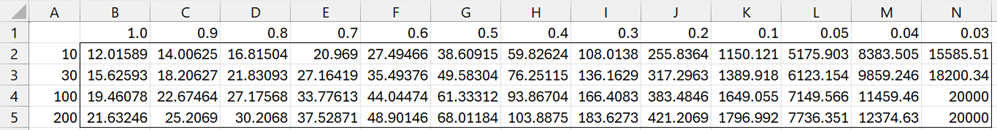
Figure 3 – Table of sample sizes (one sample case)
For example, cell G3 contains the formula =JZS_SIZE($A3,G$1). This shows that 49.58304 is the minimum sample size required to show very strong support for the alternative hypothesis with a medium effect size (δ = .5). The maximum sample size supported is 20,000, and so the values in cells N4 and N5 indicate that the sample size required is some unspecified value ≥ 20000.
Finally, Figure 4 presents a table of sample sizes for various values of BF10 and effect sizes δ using JZS_SIZE for two independent samples of the same size.
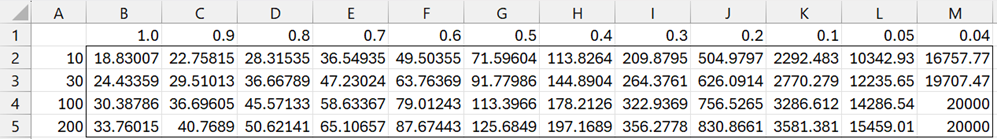
Figure 4 – Table of sample sizes (two-sample case)
For example, cell G2 contains the formula =JZS_SIZE($A2,G$1,1).
Examples Workbook
Click here to download the Excel workbook with the examples described on this webpage. The workbook also contains similar tables for the weakly informational and Jeffreys’ versions of the Bayesian t-test.
References
Reich, B. J., Ghosh, S. K. (2019) Bayesian statistics methods. CRC Press
Gronau, Q. F., Ly, A., Wagenmakers, E-J. (2018) Informed Bayesian t-tests
https://arxiv.org/pdf/1704.02479
Gonen, M., Johnson, W. O., Lu, Y., Westfall, P. H. (2005) The Bayesian two-sample t test. The American Statistician, 59(3):252–257.
https://scispace.com/pdf/the-bayesian-two-sample-t-test-2cf8tnzpmi.pdf