Objective
We describe capabilities provided by the Real Statistics Resource Pack starting with Rel 9.6 which support hypothesis testing for binomially distributed data. These implement the tests described in Beta Conjugate Prior and Bayesian Binomial Hypothesis Testing.
Worksheet Functions
The Real Statistics Resource Pack provides the following array functions.
BayesBinom(n, s, lab, alpha, beta, p): returns an array with BF01, BF10, P(H0|X), and P(H1|X) for a two-sided one-sample proportion test where n = the sample size, s = the number of successes, p = the test proportion (default .5), and alpha (default 1) and beta (default 1) are the parameters for the beta distribution prior. Here H0: population proportion = p and H1: population proportion ≠ p.
BayesBinom0(n, s, lab, alpha, beta, p): similar to BayesBinom where H0: population proportion < p and H1: population proportion ≥ p. This corresponds to one-sided analysis described in Beta Conjugate Prior.
If lab = TRUE (default FALSE), then an extra column of labels is appended to the output.
In addition, the Real Statistics Resource Pack provides the following non-array function:
BinomP(n, s, p) = the q value described in Bayesian Binomial Hypothesis Testing, used for the H–: population proportion < p and H+: population proportion ≥ p.
Data Analysis Tool
You can also use the Bayesian Proportion Test data analysis tool to perform the various one-sample proportion tests.
For Example 1, you need to press Ctrl-m and select the Bayesian Proportion Test from the Bayes tab. Next, fill in the dialog box that appears as shown in Figure 1.
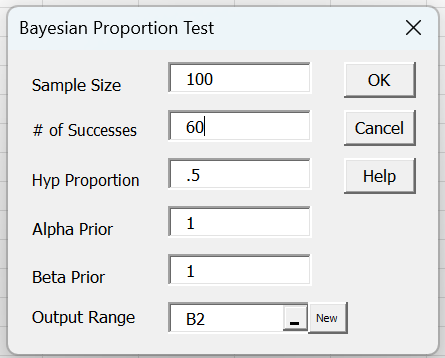
Figure 1 – Bayesian Proportion Test dialog box
Hp Proportion defaults to .5, although you can change this to any value between 0 and 1. If your version of Excel uses a comma as the decimal symbol, you can configure Real Statistics so that you use percentages, in which case the default of 50 (for 50%) would appear.
If you use the percentage default, you can’t use decimal values for Alpha Prior and Beta Prior. You can change this in the output, however. For example, you can use the default values in the dialog box and then change Alpha and Beta to .5 (0,5 if your version of Excel uses a comma as the decimal symbol) in cells C7 and C8 0f Figure 3. The output will change accordingly.
Upon clicking on the OK button on the dialog box, the output shown in Figure 2 appears.
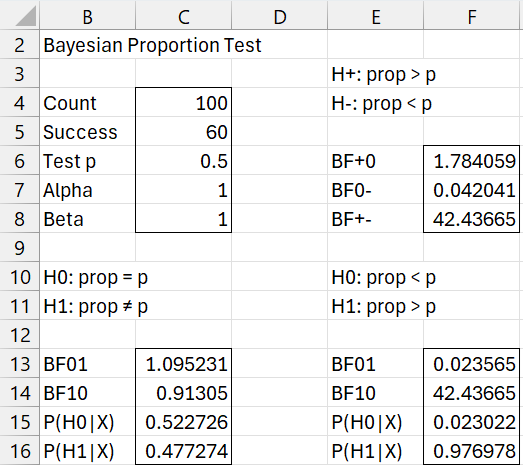
Figure 2 – Bayesian Proportion Test results
Here range B13:C16 contains the array formula =BayesBinom(C4,C5,TRUE,C7,C8,C6).
Cell F6 contains the formula =(2-BinomP(C4,C5,C6,TRUE))*C14. Cell F7 contains the formula =BinomP(C5,C4,C6,TRUE)*C14, and cell F8 contains =F6/F7.
Range E13:F16 contains the array formula =BayesBinom0(C4,C5,TRUE,C7,C8,C6).
As noted in Bayesian Binomial Hypothesis Testing, the output in range E3:F8 is only correct when p = .5, alpha = 1 and beta = 1.
Examples Workbook
Click here to download the Excel workbook with the examples described on this webpage.
References
Wikipedia (2025) Bayes factor
https://en.wikipedia.org/wiki/Bayes_factor
Nicenboim, Schad, D. J., Vasishth, S. (2025) Bayes factors. Introduction to Bayesian Data Analysis for Cognitive Science
https://bruno.nicenboim.me/bayescogsci/ch-bf.html