Objectives
We have two goals:
- determine the minimum effect size required to achieve a given level of support for the alternative (or null) hypothesis for a given sample size
- determine the minimum sample size required to achieve a given level of support for the alternative hypothesis for a given effect size
We will use the terminology described in Bayesian Hypothesis Testing and Bayesian t Test Tools. The approach is similar to that described in Bayesian t Test Sample Size.
Effect Size
For samples that follow a Bet(α, β) distribution, we will use the mean φ = α/(α+β) as a measure of effect size. Actually, it would better to use |φ – .5| since small values near 0 represent small effects and large values near 1 represent large effects. But since we use φ elsewhere, we’ll stick with φ.
For our purposes we will look at values of φ between .5 and 1, which relate to testing the alternative hypothesis that φ ≥ .5.
Example
Example 1: What is the minimum effect size required to achieve BF01 ≥ 10 when n = 20.
We use the spreadsheet shown in Figure 1. Here we put the array formula =BETA.DIST(0.5, A2, B2, TRUE) in cell C2, =1-C2 in cell D2, and =D2/C2 in cell E2. Then we highlight C2:E11, and press Ctrl-D.
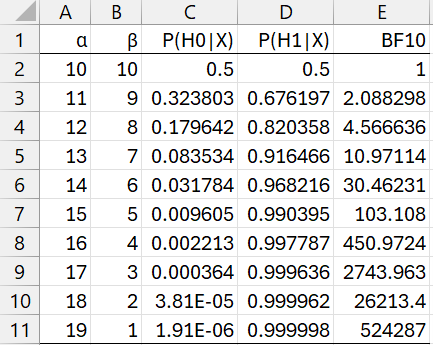
Figure 1 – BF10 for different value of alpha when n = 20
We see that BF10 ≥ 10 is achieved when α = 13 (row 5). This is equivalent to φ = 13/20 = .65.
When we are performing posterior analysis, then we need to take the prior into account. E.g. for a uniform prior, this level of support for the alternative hypothesis is achieved when the real sample size is 20-2 = 18. Similarly, alpha and beta are reduced by 1.
Since beta priors can have fractional parameter values, we might be interested in the phi value needed to obtain BF10 equal precisely to 10. We can use Goal Seek, as in Bayesian t Test Sample Size, to obtain this value. Alternatively, we can use a or a divide and conquer approach, as we have done in the following worksheet function.
Worksheet Function
The Real Statistics Resource Pack provides the following function:
BETA_EFFECT(bf, n) = minimum phi value needed to obtain BF10 = bf for a “sample” of size n
For Example 1, we can use =BETA_EFFECT(10, 20) to obtain φ = .645034. This is obtained when α = .645034 ⋅ 20 = 12.9067 and β = 20 – 12.9067 = 7.0933.
To achieve BF10 = 100 requires φ = .748853 using =BETA_EFFECT(10, 20), resulting in α = 14.97706 and β = 5.02294.
Note too that to obtain BF01 = .1 for a sample of size 20, we use the formula =1-BETA_EFFECT(1/.1, 20) = 1 – .645034 = .354966 (or less). which is obtained when α = 7.0933 and β = 12.9067.
Sample Size
Example 2: determine the minimum sample size required to achieve BF10 = 10 for the alternative hypothesis for φ = .6.
This time we can use the spreadsheet shown in Figure 2.
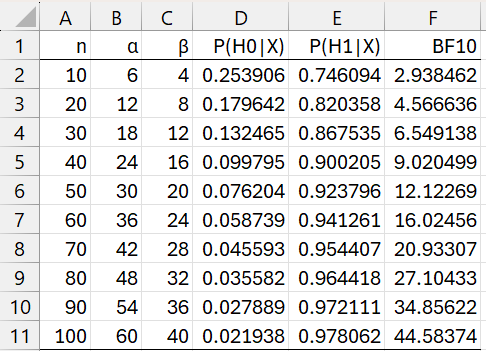
Figure 2 – Minimum sample size
We see that BF10 ≥ 10 when n = 50 (row 6).
Worksheet Function
The Real Statistics Resource Pack provides the following function:
BETA_SIZE(bf, φ) = minimum sample size needed to obtain BF10 = bf for an effect of size φ.
For Example 2, we can use the formula =BETA_SIZE(10, .6) to obtain n = 43.41113. This is obtained when α = 43.41113 .6 = 26.04668 and β = 43.41113 – 26.04668 = 17.36445.
To achieve BF10 = 100, we use =BETA_SIZE(100,.6) to obtain n = 133.9688, with α = 80.3813 and β = 53.5875.
This is equivalent to a sample of size 133.9688 to obtain BF01 = .01 when φ = .4.
Examples Workbook
Click here to download the Excel workbook with the examples described on this webpage.
References
Reich, B. J., Ghosh, S. K. (2019) Bayesian statistics methods. CRC Press
Kruschke, J. K. (2015) Doing Bayesian data analysis. 2nd Ed. Elsevier
https://sites.google.com/site/doingbayesiandataanalysis/