The analysis for Example 1 of Mixed Repeated Measures ANOVA using Regression can also be done using the Real Statistics Mixed Repeated Measures ANOVA data analysis tool.
Data Analysis Tool
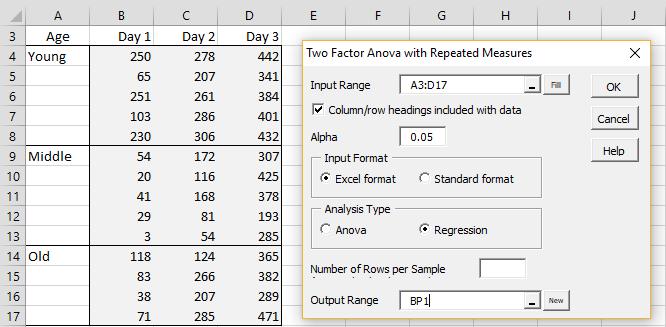
To accomplish this, press Ctrl-m and double-click on the Analysis of Variance option from the menu that appears, and then select Repeated Measures: mixed from the dialog box that appears. If using the multipage interface, after pressing Ctrl-m, click on the Anova tab and select the Mixed Repeated Measures ANOVA option. In either case, fill in the dialog box that appears as shown in Figure 1.
Figure 1 – Mixed Repeated Measures ANOVA dialog box
Note that you can leave the Number of Rows per Sample field blank. When you click on the OK button, the output shown in Figure 2 appears.
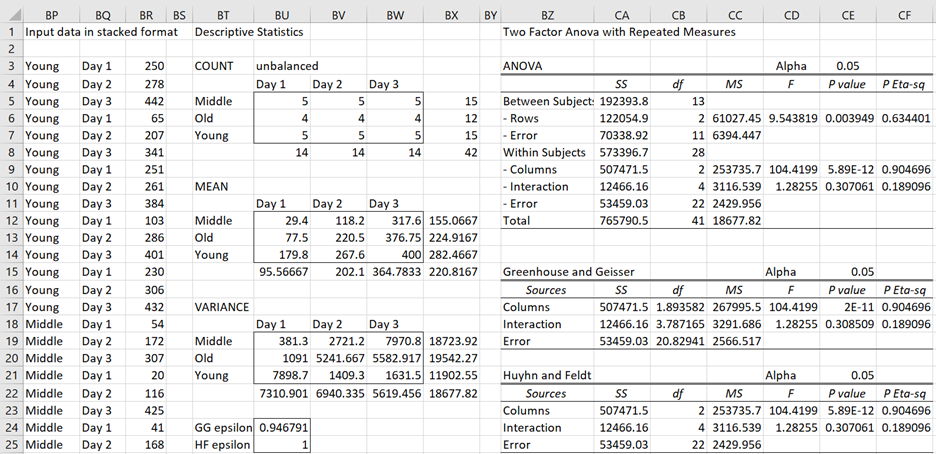
Figure 2 – Mixed Repeated Measures ANOVA analysis
The input data is converted to standard (stacked) format (range BP3:BR44, only the first 23 rows are displayed). Note too that the output shown in range BZ3:CF12 is identical to that shown in Figure 3 of Mixed Repeated Measures ANOVA using Regression. The GG epsilon and HF epsilon values shown in BU24 and BU25 are calculated by the formulas =GG_Epsilon(A3:D17) and =HF_Epsilon(A3:D17).
Note that if the data was originally in standard format, we could have inserted BP3:BR44 in the Input Range in Figure 1 and selected the Standard format option, and the output would be identical to that shown in Figure 2, except that the data would also be converted to Excel format, which would be used by the GG_Epsilon and HF_Epsilon functions.
Worksheet Functions
Real Statistics Functions: The Real Statistics Resource Pack contains the following two functions which are similar to the GGEpsilon and HFEpsilon functions described in Sphericity, except that this time, the input range contains the labels (A3:D17 in Figure 2, and not just B3:D17).
GG_Epsilon(R1) = GG epsilon correction factor for the data in R1
HF_Epsilon(R1) = HF epsilon correction factor for the data in R1
Examples Workbook
Click here to download the Excel workbook with the examples described on this webpage.
Reference
Howell, D. C. (2010) Statistical methods for psychology (7th ed.). Wadsworth, Cengage Learning.
https://labs.la.utexas.edu/gilden/files/2016/05/Statistics-Text.pdf

