Data Analysis Tool for LDA
Real Statistics Data Analysis Tool: The Real Statistics Resource Pack provides the Discriminant Analysis data analysis tool which automates the steps described in Linear Discriminant Analysis. We now repeat Example 1 of Linear Discriminant Analysis using this tool.
To perform the analysis, press Ctrl-m and select Discriminant Analysis from the Multivar tab. (If using the original interface, select the Multivariate Analyses option from the main menu and then Discriminant Analysis from the dialog box that appears).
Now, fill in the dialog box that appears as shown in Figure 1, and press the OK button.
Figure 1 – Discriminant Analysis dialog box
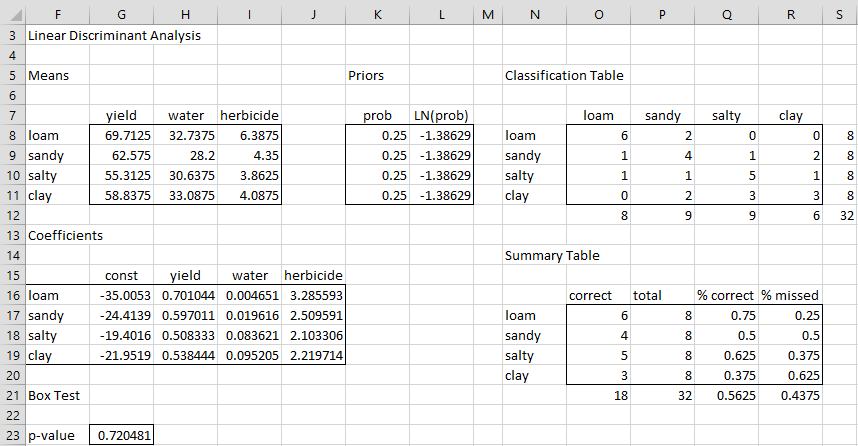
The Training Range contains the data shown in Figure 1 of Linear Discriminant Analysis. Note that we have chosen the Automatic option. For this example, this option is equivalent to the Linear option since as we can see from cell G23 of Figure 2, the Box Test indicates that linear discriminant analysis can be used. We have also left the Priors Range blank and so express no prior preference for any of the four independent variables. This means that each is assigned the value .25 by default (as shown in range K8:K11 of Figure 2).
Output from Data Analysis
The output from the analysis is shown in Figure 2.
Figure 2 – Output from Discriminant Analysis data analysis tool
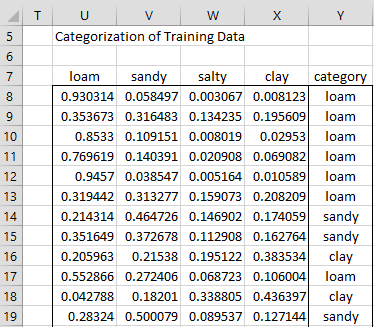
Since the Show categorization for training data option was selected in Figure 1, we see the results in Figure 3 (for the first 12 training vectors). Note that the probability for each of the categories is displayed.
Figure 3 – Categorization of training data
Data Analysis Tool for QDA
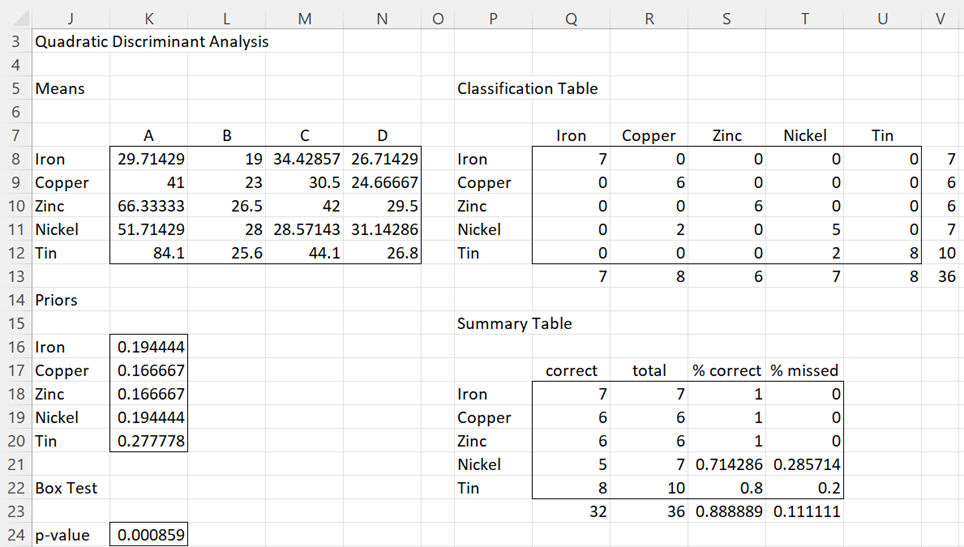
We can also use the Discriminant Analysis data analysis tool for Example 1 of Quadratic Discriminant Analysis, where quadratic discriminant analysis is employed. This time, we insert A3:E39 from Figure 1 of Quadratic Discriminant Analysis in the Training Range of the dialog box shown in Figure 1.
We also need to assign an explicit Priors Range in the dialog box; otherwise, the default of .20 for each of the five categories will be used. We can use the range V15:V19 from Figure 3 of Quadratic Discriminant Analysis.
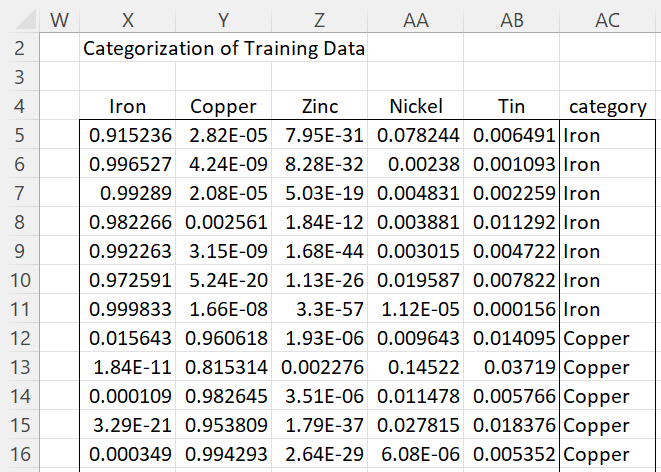
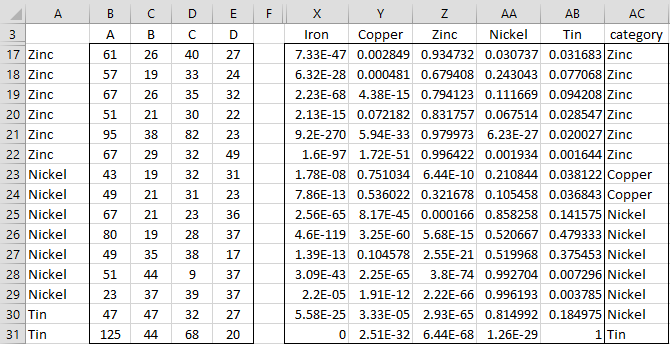
The output is shown in Figures 4 and 5. Only the first 12 vectors are displayed in Figure 5.
Figure 4 – Quadratic Discriminant Analysis (part 1)
Figure 5 – Quadratic Discriminant Analysis (part 2)
Worksheet Functions
Real Statistics Functions: The following array functions are provided by the Real Statistics Resource Pack and are used by the Discriminant Analysis data analysis tool.
LDACoeff(Rt, head): returns an array with the LDA coefficients for the (training) data in Rt consisting of one row for each independent variable whose columns consist of the name of the independent variable, the intercept coefficient, and a coefficient for each dependent variable. If head = TRUE (default), then the data in Rt contains column headings (corresponding to the names of the dependent variables); these headings are also appended to the output from this function.
LDAPredC(R0, Rc, Rp, lab): returns an array whose rows contain the probabilities for each vector in the data array R0 (which contains no row/column headings) using the LDA coefficient array in array Rc (without column headings) and prior probabilities in the column array Rp. A column of names of the independent variable that has the highest probability is also appended to the output.
LDAPred(R0, Rt, Rp, lab) = LDAPredC(R0, LDACoeff(Rt,FALSE), Rp, lab), i.e. the predictions for the vectors in R0 based on the LDA model defined by Rt and Rp.
QDAPred(R0, Rt, Rp, lab): returns an array whose rows contain the probabilities for each vector in the data array R0 (which contains no row/column headings) and the name of the independent variable with the highest probability as for the LDAPred function, except that the QDA model is used instead of the LDA model.
DAClassification(Rt, Rp, linear): returns a classification for the training data in Rt and priors in Rp. If linear = TRUE (default), then the classification table is based on an LDA model, while if linear = FALSE then a QDA model is used instead.
DASummary(R1): returns a summary of the classification table in range R1
If Rp is omitted then equally probable priors are used. If lab = TRUE (default FALSE) then column headings are added to the output.
Using the Worksheet Functions
In Figure 2, range F16:J19 contains the array worksheet formula =LDACoeff(A4:D35,FALSE). Alternatively, range F15:J19 could contain the array formula =LDACoeff(A3:D35). Range S7:N12 contains the array formula =DAClassification(A4:D35,K8:K11,TRUE) and range N16:R21 contains the formula =DASummary( N7:S12).
U7:Y39 contains the formula =LDAPredC(B4:D35,F16:J19,K8:K11,TRUE) (see Figure 3).
Finally, the formula =QDAPred(B4:E39,A4:E39,K16:K20,TRUE) in range X3:AC31 of Figure 5 creates the predictions for 15 vectors shown on the left side of the figure based on the QDA model for Example 1 of Quadratic Discriminant Analysis (here only 15 of the 36 rows of training data are displayed). Note that rows 23, 24, and 31 are misclassified by the model. In fact, only one other row is misclassified, resulting in an accuracy of 32/36 = 89%.
Figure 5 – Predictions using QDA model
Examples Workbook
Click here to download the Excel workbook with the examples described on this webpage.
Reference
Penn State (2017) Discriminant analysis. STAT 505 Applied Multivariate Statistical Analysis
https://online.stat.psu.edu/stat505/lesson/10

Hello Charles, How do I get the coefficients of quadratic discriminant analysis?
Hello Moreno,
See https://www.real-statistics.com/multivariate-statistics/discriminant-analysis/quadratic-discriminant-analysis/
You can also use the worksheet functions described at
https://www.real-statistics.com/multivariate-statistics/discriminant-analysis/discriminant-analysis-tools/
Charles
Hi. I’m trying to run a Discriminant analysis but the Dialog box doesn’t open when I select the option. I get a runtime error ‘424’ saying Object required? Andy
Where is the cut-off value for to classify? Thanks
There is no cutoff.
Charles
This is pretty neat. Is it possible for me to get a copy? I’m not a student.
Steve,
You can download the examples or software by going to https://real-statistics.com/free-download/
Charles
Hi Charles,
What is the significance of the ‘Box Test’, p-value in teh output of Discriminant Analysis?
Thanks,
Swami
Box’s test is used to check whether the covariance matrices are the same (see discussion in the MANOVA section of the website).
Charles
Dear Mr Zaiontz
I can not find in the discriminant analyse tool the “canonical discriminant function” (Function 1 in XLSTAT), that allows to calculate a score for each vector.
Could you help me to calculate it ?
Sincerely
Roland
Roland,
I am not familiar with XLSTAT, and so I don’t know what function 1 does.
Charles