Multivariate statistics employs vectors of statistics (mean, variance, etc.), which can be considered an extension of the descriptive statistics described in univariate Descriptive Statistics.
Mean, Variance, and Standard Deviation Vectors
Definition 1: Given k random variables x1, …, xk and a sample of size n for each variable xj of the form xij, …, xnj. We can define the k × 1 column vector X (also known as a random vector) as
![]()
(also written more simply as X = [xj]) and then define the sample mean (vector) of X to be

and similarly for the sample variance, standard deviation and other statistics. Also if the μj are the population means of the xj then the population mean (vector) of X is defined to be
![]()
and similarly for population variance, standard deviation, etc. We can also define row vector versions of these.
Example
Example 1: Figure 1 shows the following statistics for each of the EU countries: gross national product (GDP) per capita (measured in the purchasing power parity with thousands of US dollars), accumulated public debt (as a percentage of GDP), current annual public deficit (as a percentage of GDP), current annual inflation rate and percentage of the population that is unemployed. Find the sample mean vector.
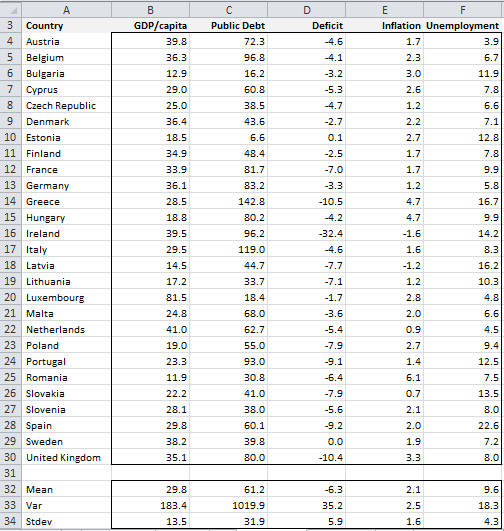
Figure 1 – Data for Example 1
The sample means row vector (range B32:F32) is [29.8, 61.2, -6.3, 2.1, 9.6], and similarly for variance and standard deviation. We can also look at column vector versions of these statistics. E.g. the sample variance column vector is
![]()
Covariance and Correlation Matrices
Definition 2: Given a k × 1 column vector of random variables X = [xj] and samples of size n for each variable xj of the form xij, …, xnj. We can define the k × k sample variance-covariance matrix (or simply the sample covariance matrix) S as [sij] where sij = cov(xi, xj). Since cov(xj, xj) = var(xj) = 
Similarly, we can define the population variance-covariance matrix (or simply the population covariance matrix) Σ as above where the covariances are population covariances.
The sample and population correlation matrices can be defined as [rij] where
![]()
Since
![]() it follows that the main diagonal of this matrix consists only of 1’s.
it follows that the main diagonal of this matrix consists only of 1’s.
Matrix Equations
By Property 0 of Least Squares in Multiple Regression, the sample covariance matrix can be expressed by the matrix equation
![]()
where X̄ is the 1 × k row vector of sample means. Also, the correlation matrix can be expressed as
![]()
where D = the 1 × k row vector of sample standard deviations.
Example
Example 2: Calculate the sample covariance and correlation matrices for the data in Example 1.

Figure 2 – Sample covariance and correlation matrices
Referring to both Figure 1 and 2, the sample covariance matrix is constructed by highlighting range H5:L9 (or any other 5 × 5 range) and entering the Real Statistics array formula =COV(B4:F30) or optionally the standard Excel formula
=MMULT(TRANSPOSE(B4:F30-B32:F32),B4:F30-B32:F32)/(COUNTA(A4:A30)–1)
The correlation matrix is constructed by highlighting the range N5:R9 and entering the formula
=COV(B4:F30)/MMULT(TRANSPOSE(B34:F34),B34:F34)
Eigenvalues
Property 1: If λ1, …, λk are eigenvalues of S then
![]()
Proof: By Property 1 of Eigenvalues and Eigenvectors, the trace of S equals the sum of the eigenvalues of S, but as we observed earlier, the elements on the diagonal of S are the variances, and so the sum of these variances is also equal to the trace of S.
References
Johnson, R. A., Wichern, D. W. (2007) Applied multivariate statistical analysis. 6th Ed. Pearson
https://www.webpages.uidaho.edu/~stevel/519/Applied%20Multivariate%20Statistical%20Analysis%20by%20Johnson%20and%20Wichern.pdf
Rencher, A.C., Christensen, W. F. (2012) Methods of multivariate analysis (3nd Ed). Wiley
http://ndl.ethernet.edu.et/bitstream/123456789/27185/1/Alvin%20C.%20Rencher_2012.pdf
Dear Dr. Charles,
I have a multivariate sample like that in your Example 1, that is:
A B C………………K
Subj#1 a1 b1 c1……………..k1
Subj#2 a2 b2 c2……………..k2
…..
Subj#n an bn cn…………….kn
I computed the correlation matrix to check which variates are more correlated among themselves.
Now, I have 4 of the above samples, in which subjects are Males Pre-Treatment, Males Post-Treatment, Females Pre-Treatment and Females Post-Treatment respectively. I computed the correlation matrix for each group.
My question is: can I pool the 4 correlation matrices together to have a unified view about the correlation between variates? Or should I pool the 4 matrices of data and then compute the correlation matrix?
Thank you very much
Best Regards
Piero
Piero,
It really depends on how you plan to use the result. Either approach could make sense.
Charles
Charles,
thank you for your answer. Should I check some assumption before to pool the correlation matrices (or before to pool the data)?
My goal is to investigate if there is a “strong” correlation between some pairs of variates that holds in general and not only for a specific group.
Thank you very much
Piero
Piero,
I am sorry but I don’t know the answer to your question. Perhaps someone else in the community can help.
Charles
Dear Sir
after calculation of correlation matrix, how can we decide which variable we select for analysis and which variable we left from the analysis. how we chose stimulant and de-stimulant variable form the total selected indicator.
Hello,
I am sorry, but I don’t understand your question. What criteria are you using to decide which variables to select and which not to select?
Charles
Hello Rajesh,
In the example that you tried was it consistent with what you were asking or was it a counter-example?
Charles
Hi I tried, but I am not getting the answer.
Sir,
In PCA, from a Co-Variance Matrix Eigen Values and Eigen Vectors were found. For Example, for 3×3 Co-Variance Matrix, we get 3 Eigen Values and 3 Eigen Vectors (i.e.) 3 Column Vectors of 3×1
Then, Eigen Value 1 multiplied by Eigen Vector 1, shold be same as Eigen Value 2 multiplied by Eigen Vector 2, and so on till Eigen Value n.
Is my understanding right, or any correction required on the same.
Hello Rajesh,
Did you try to check whether this is true using a real example?
Charles
Dr Zaionits, good evening, please how can I approach a general linear model, using Real Statistics ?.
Thank you very much
Dr Zaionits, buenas noches, por favor como puedo abordar un modelo lineal general, utilizando real Statistics?.
Muchas gracias
Gerardo,
Real Statistics doesn’t provide a single general linear model data analysis tool, but the general linear model approach is used in many of the data analysis tool (e.g. ANOVA using regression).
Charles
Ok, perfect Dr
Thank you very much
Hi,
im looking to calculate the mean vector of X and X roof. I read it may have something to do with anova
Philip,
Is X roof the same thing as X hat (predicted value) or X bar (mean)?
Charles
Dr. Buenas tardes, ¿podría pensar en la aplicación de análisis de correspondencias, en el paquete de estadísticas reales?
Dr. Good evening, could you think in implementing Correspondence Analyisis, in real statistics pack?
Gerardo,
It is on my list of future enhancements.
Charles
Thank you very much
Hello,
I am trying to compare villages that are inside and outside protected areas. I have 30 variables (ordinal) from fieldwork equally collected for 236 villages ( 75 inside and 162 outside ).
Is there any test to compare these 2 groups, considering 30 variables??
Thank you very much
Sil
Hello Sil,
It sounds like Hotelling’s T-Square test. See the following webpage
https://real-statistics.com/multivariate-statistics/hotellings-t-square-statistic/hotellings-t-square-independent-samples/
Charles
Hi
I’m looking an appropriate test-statistic to compare tests results of 4 groups (Years) of an intelligence-test with overall results and results of factors (verbal/math/nonverbal). Every year particpicants with different sex and country took part.
Thanks for help
Manfred,
It does sound like a multivariate test, but I can’t tell which is the appropriate test statistic from the information that you have provided.
Charles
I calculated the COVARIANCE matrix using the formula suggested by you. The values are different from yours (using COV). also, if use EXCEL’s COVAR to populate each cell of the Covraince matrix, the values are different.
Can you help me understand why these differences?
Excel’s COVAR function calculates the population covariance of two sets, while COV calculates a sample covariance matrix. You need to use COVP to calculate the population covariance matrix or COVARIANCE.S (in Excel 2010/2013) to calculate a sample covariance. You can also use COVAR(R1,R2)*n/(n-1) to calculate the sample covariance where n = COUNT(R1) = COUNT(R2).
The formula suggested by me only works properly if there is no missing data in any of the cells. If there is some missing data =COV(R1) will ignore any row which contains missing data. If this isn’t what you want you may prefer to use the formula =COV(R1,FALSE). See the webpage https://real-statistics.com/multiple-regression/least-squares-method-multiple-regression/ for more information about this.
If none of this helps, then if you like please send me an Excel worksheet with an example of where the calculations don’t come out correctly. I will look at it and try to figure what the problem is.
Charles